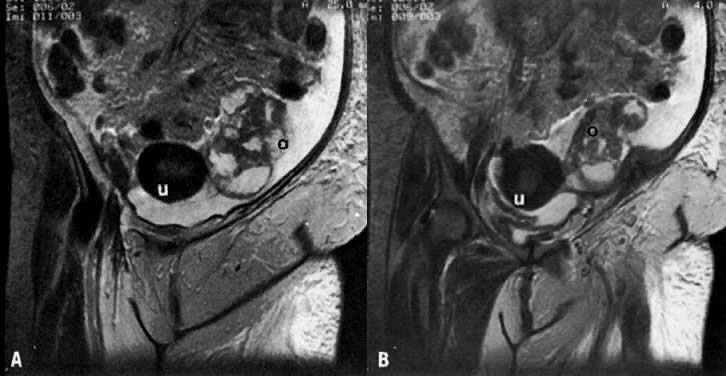
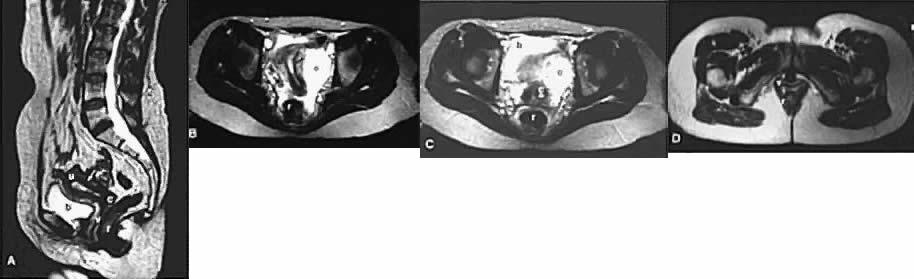
 Fig. 1. T2-weighted MRI of a normal female pelvis. A. Sagittal view of the uterine body, cervix, and vagina.
Volume 4, Chapter 54
Fig. 1. T2-weighted MRI of a normal female pelvis. A. Sagittal view of the uterine body, cervix, and vagina.
Volume 4, Chapter 54
|
Magnetic Resonance Imaging Michael John Hughey |
|
|
Michael John Hughey, MD |
| Normal |
|
|
| Leiomyomas |
|
| Adenomyosis |
|
| Hemorrhagic Ovarian Cyst |
|
| Endometrioma |
|
| Dermoid |
|
| Simple Ovarian Cyst |
|
| Uterine Prolapse |
|
| Hydrometra |
|
|
| Post-irradiation Fibrosis |
|
| Endometrial Cancer |
|
|
| Cervical Cancer |
|
|
|
|
|
|
|
|
|
|
| Ovarian Cancer |
|
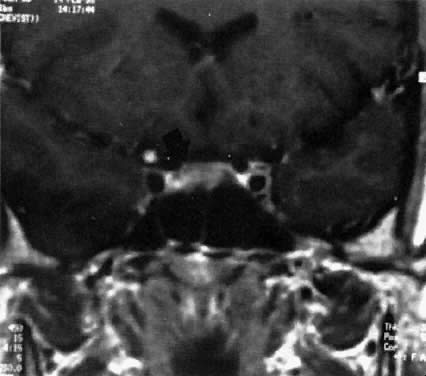
| Pituitary Microadenoma |
|
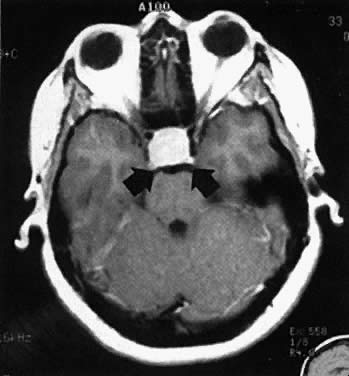
| Pituitary Macroadenoma |
|
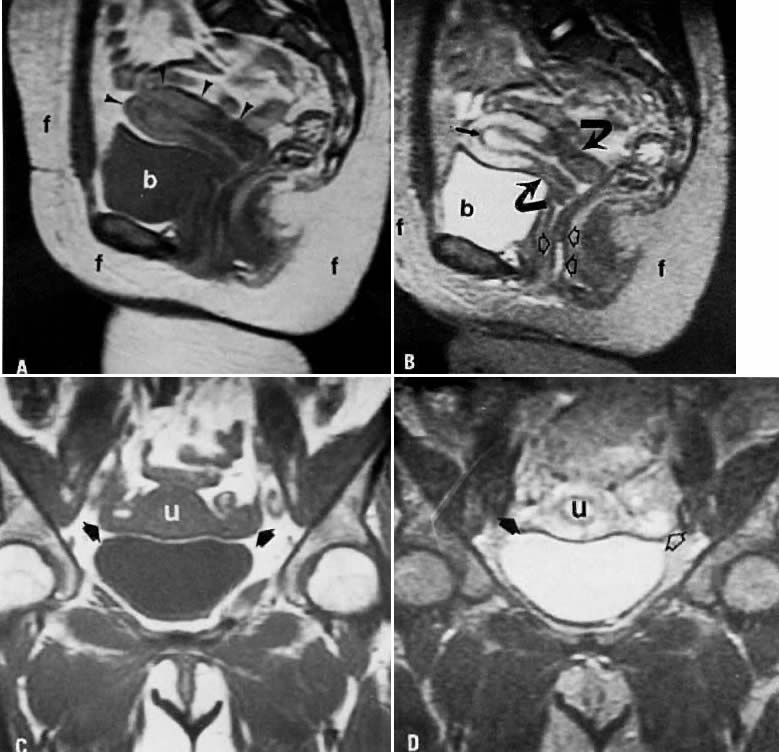
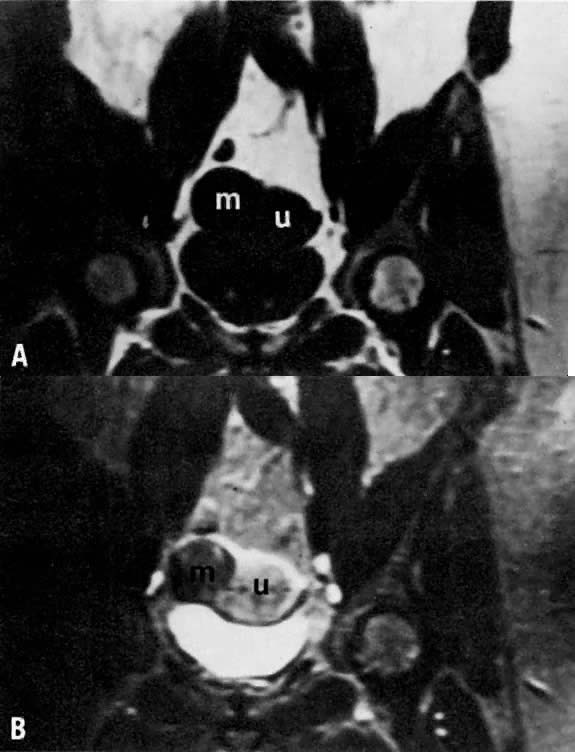
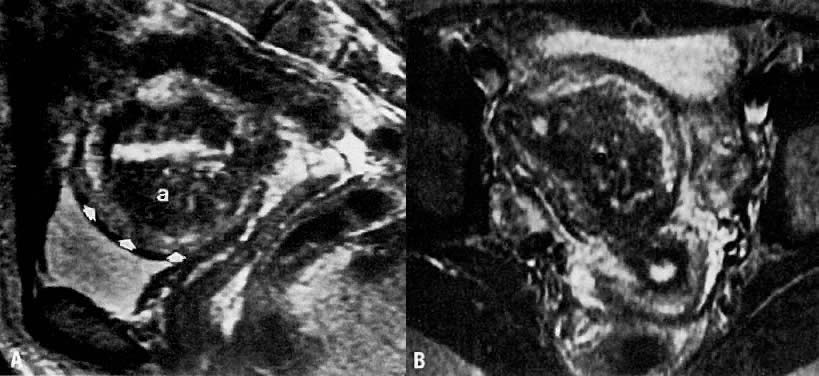
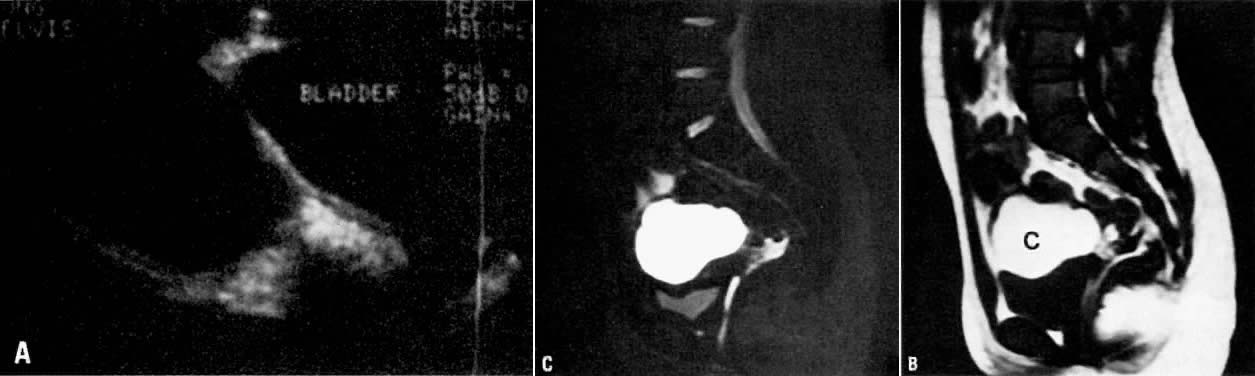
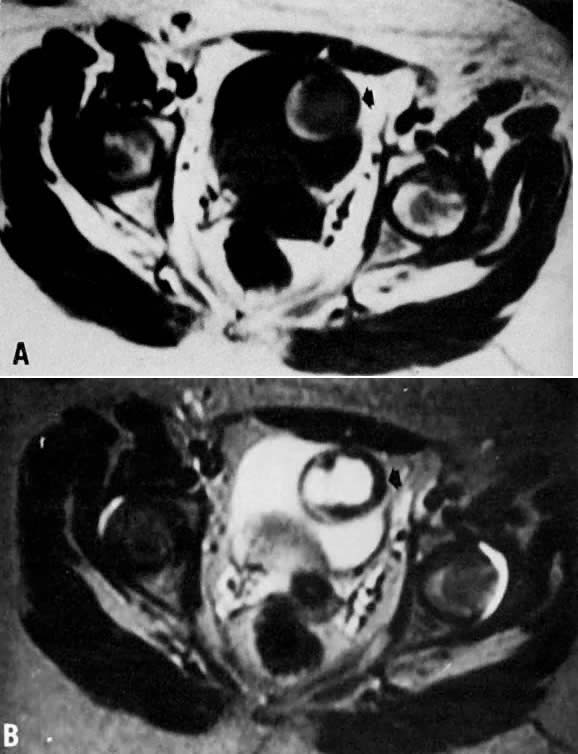
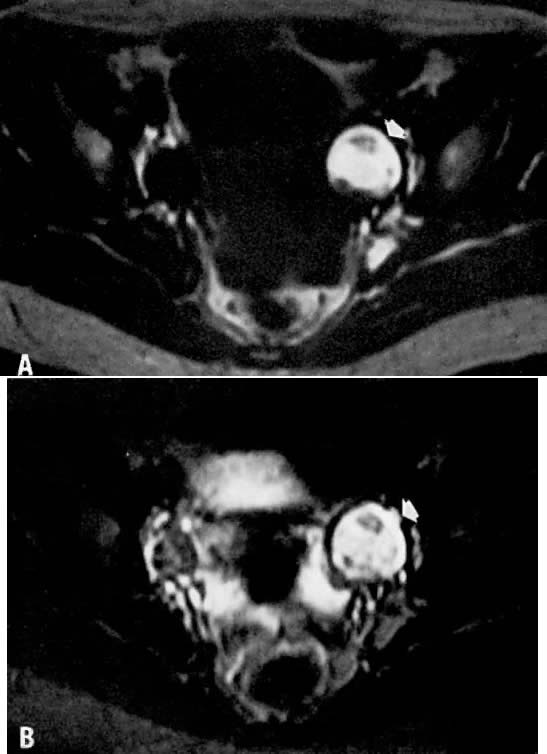
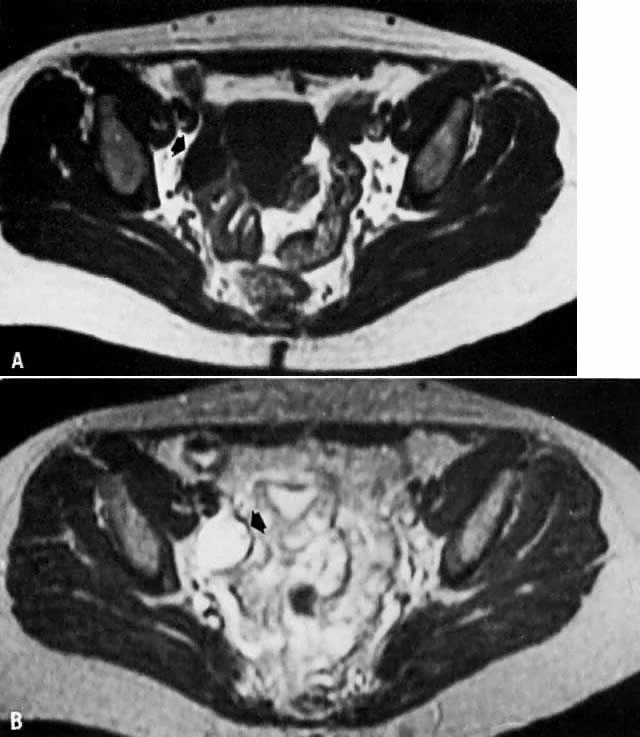
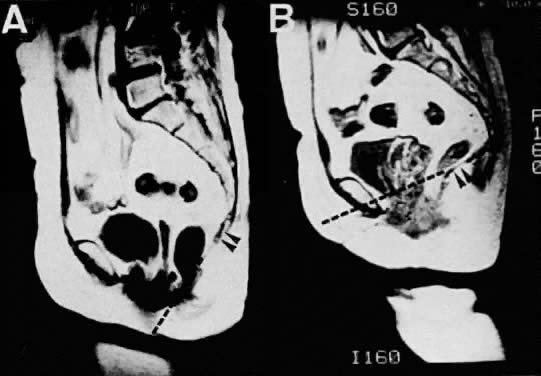
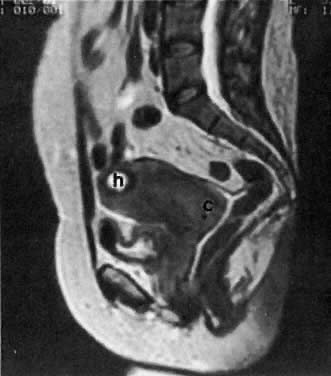
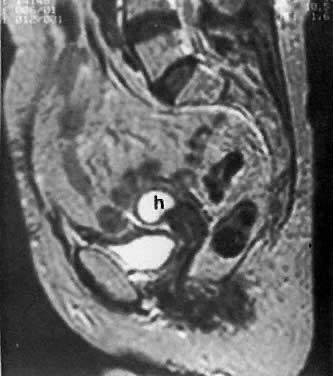
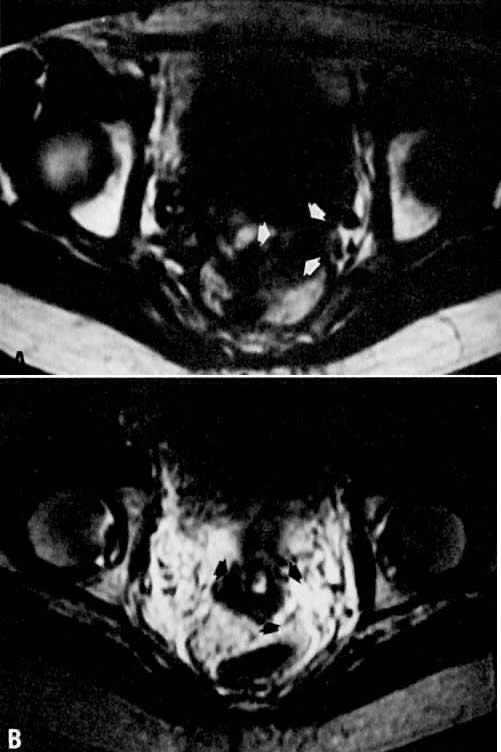
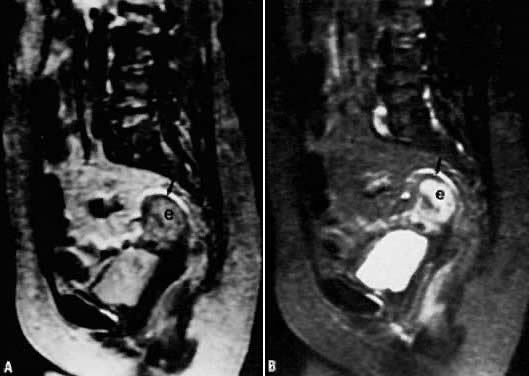
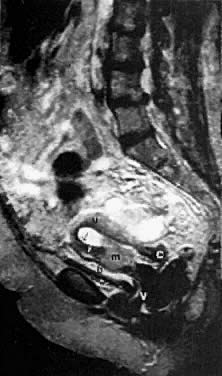
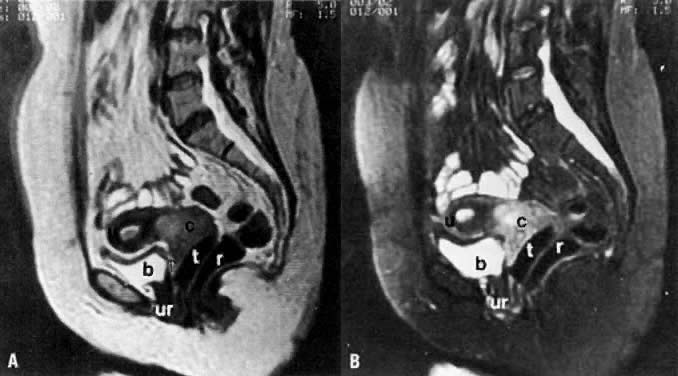
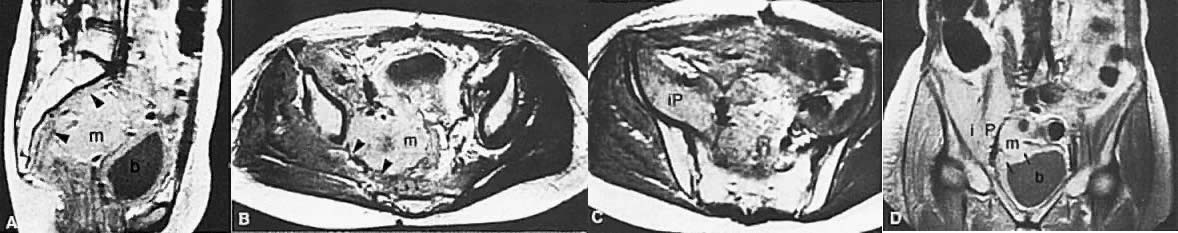
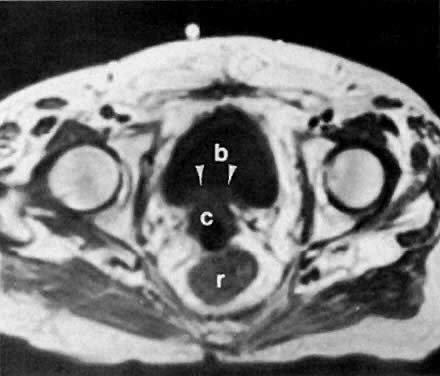
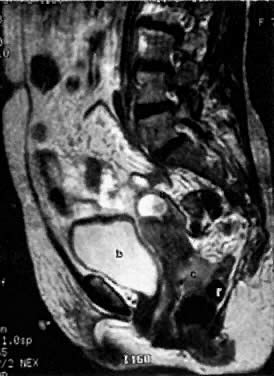
 Fig. 57.