Chapter 54
Documentation of Ovulation
Kamran S. Moghissi
Main Menu   Table Of Contents

Search

Kamran S. Moghissi, MD
Professor Emeritus, Department of Gynecology and Obstetrics, Division of Reproductive Endocrinology and Infertility, Wayne State University School of Medicine and Hutzel Hospital, Detroit, Michigan (Vol 5, Chap 54; Vol 6, Chap 12)

 
TESTS BASED ON HORMONAL ASSAYS
TESTS BASED ON PERIPHERAL AND SYSTEMIC CHANGES
CONSISTENCY (VISCOSITY)
ENZYMES
ULTRASOUND
OTHER METHODS
CONCLUSION
REFERENCES

Documentation of ovulation is an important step in the evaluation of infertile women. Timing of ovulation may be of equal importance when procedures such as artificial insemination are contemplated.

Definite proof of ovulation is establishment of pregnancy or recovery of an ovum from the oviducts. Direct observation of corpus luteum with the presence of a stigma by pelvic endoscopy or laparotomy may be considered strong evidence of ovulation. Presumptive evidence of ovulation may be obtained by steroid or gonadotropic hormone assays in the blood or urine, by peripheral changes in the reproductive tract and other sites associated with ovulation or by the collapse of fully developed grafian follicle demonstrated by serial echography in the periovulatory period.

An understanding of the hormonal events that control the ovulatory process is essential to appreciate the physiologic basis of many tests that have been devised for the documentation and timing of ovulation.

Maturation of ovarian follicles is effected by the tropic action of follicle-stimulating hormone (FSH) and luteinizing hormone (LH) secreted by the anterior lobe of the pituitary gland. Release of FSH and LH is, in turn, controlled by gonadotropin-releasing hormone (GnRH), which is produced by the hypothalamus in a pulsatile fashion. The pattern of FSH and LH secretion during the menstrual cycle is shown in Figure 1.1,2,3,4 In the first part of the follicular phase, serum FSH and then LH begin to rise concomitant with follicular growth. Late in the follicular phase, FSH levels decline but LH levels continue to rise throughout the follicular phase. Associated with this gradual rise of LH activity is an increase in the frequency of LH pulses. The ovulatory phase is characterized by a rapid and significant rise of LH, which culminates in the LH peak. Ovulation usually occurs within 16 to 24 hours after the LH surge. FSH also rises in midcycle, but to a lesser degree. Both FSH and LH levels show a progressive decline during the luteal phase.

Fig. 1. Composite profile of serum gonadotropin and progesterone, urinary estrogens and pregnanediol, basal body temperature (BBT), karyopyknotic index (KPI) of vaginal cytology, and cervical mucus properties throughout the menstrual cycle in 10 normal women. Day 0 = day of luteinizing hormone peak (dotted line). Vertical bars represent one standard error of the mean. F1 and F2 indicate the number of sperm in the first and second microscopic fields (200×) from interface, 15 min after the start of the in vitro cervical mucus penetration test.(Moghissi KS, Syner FN, Evans TN: A composite picture of the menstrual cycle. Am J Obstet Gynecol 114:405, 1972.)

The developing follicle synthesizes increasing amounts of estrogen and other peptides. Serum estradiol (E2) rises slowly at first, then rapidly, peaking approximately 1 day before the LH surge. The sustained rise in E2 during the late proliferative phase, more than 200 pg/mL (730 pmol/L) for approximately 50 hours, triggers the preovulatory LH surge, which in turn is followed by ovulation. The level of serum progesterone is negligible during the follicular phase. Within 6 hours of the start of the LH surge, the granulosa cells luteinize and begin to secrete progesterone, initially into the follicular fluid but later into the ovarian vein and general circulation. A rise in the concentration of progesterone in peripheral blood can usually be detected within 12 hours (i.e., approximately 24 hours before ovulation). After ovulation, the follicle becomes highly vascularized and the corpus luteum is formed and secretes increasing amounts of progesterone, as well as estrogen. Maximal progesterone and estrogen output is reached about 8 days after the LH peak. The corpus luteum has a predetermined life span of approximately 14 days.

A family of putative intraovarian peptides synthesized by granulosa cells in response to FSH stimulation has been shown to play an important role in the modulation of gonadotropin secretions. These include inhibins A and B and activins A, B, and AB. Inhibins suppress FSH synthesis and secretion. Activin is a peptide related to inhibin, but it has an opposite action in that it stimulates FSH release. Follistatin is a single-chain polypeptide produced in the pituitary but found predominantly in preovulatory follicles. It is expressed by granulosa cells in response to FSH. It modifies FSH activity by binding activin, thus removing it from cellular activity. It also possesses weak activity similar to inhibin.

Inhibin levels rise slowly but steadily throughout the follicular phase to reach a midcycle peak that coincides with the gonadotropin surge. After ovulation, inhibin levels drop slightly from the midcycle peak, then rise again to reach a level at midluteal phase that is at least twice that of the midcycle peak.

Declining estrogen and progesterone levels at the end of the luteal phase lead to vasospasm of endometrial vessels, endometrial necrosis, sloughing, and bleeding. The systemic and reproductive effects of estrogen and progesterone are well known and form the basis for many methods of ovulation detection.

For practical purposes, techniques of ovulation detection and timing may be classified into two groups: direct assays of gonadotropins or steroid hormones in the serum, urine, or saliva and evaluation of peripheral changes preceding, coinciding with, or succeeding the ovulatory process.

In clinical practice, serial hormone assays are cumbersome and expensive. Therefore, clinicians must rely principally on peripheral or end-organ changes to determine alterations in circulating steroid hormone levels. However, direct assays of gonadotropins and sex steroids would have to be used to determine the accuracy of commonly performed methods of ovulation detection. Furthermore, random sampling of these hormones may be used to confirm the results of simpler tests.

Recent technological improvements in hormone assays have resulted in the development of easy-to-use kits for measuring steroid and gonadotropic hormones in the urine. These promising techniques have considerably improved the accuracy of ovulation prediction and detection.

Back to Top
TESTS BASED ON HORMONAL ASSAYS

Useful hormonal determinations include daily assays of LH, estrogens, and progesterone (or their metabolites) in the serum, urine, or saliva.

The temporal relation between ovulation and defined changes in the concentration of plasma E2, LH, FSH, and progesterone is well established. The median time intervals (in hours) from the hormonal events to ovulation and the 95% confidence limits of the estimates are 17B E2: rise 82.5 (54.0 to 100.5), peak 24.0 (16.1 to 32.1); LH: rise 32 (23.6 to 38.2), peak 16.5 (9.5 to 23.0); FSH: rise 21.1 (14.1 to 30.9), peak 15.3 (8.1 to 21.7); progesterone: rise 7.8 (−12.5 to 15.9). From the statistical model for LH, it has been possible to estimate that in 90% of cases, ovulation occurs between 16 (±6) and 48 (±6) hours after the first significant rise in the concentration of this hormone and between −3 (±5) and 36 (±5) hours after the peak.5,6,7

Serum or Urinary Luteinizing Hormone

Laboratory assays of LH are now readily available in most hospitals and through commercial laboratories. Daily assay of serum LH in midcycle can detect the LH surge, which is presumed to occur before actual ovulation. Serial blood sampling is obviously cumbersome and unacceptable to most patients. For maximal accuracy, the serum assay of LH takes 3 to 5 days. Rapid assays, requiring as little as 4 to 6 hours, have been developed and are used in larger institutions.

Urinary assay of LH is much simpler and has the advantage of integrating any episodic variation in secretion. There is some evidence for a delay of 6 to 7 hours in excretion of LH into urine, but such delay is of little practical importance. The preovulatory LH rise appears to have a circadian incidence, occurring in the early morning in most women. Frequent sampling (e.g., every 3 hours) considerably increases the accuracy of detection of the beginning of the LH rise.

With the development of monoclonal antibody technology, several dipstick kits for rapid assay of urinary LH have become available. These are based on enzyme immunoassay techniques and are designed to be used by the patient at home once or twice per day (morning and evening), beginning approximately 4 days before suspected ovulation. For optimal efficiency in identifying the urinary LH surge, twice-daily testing is recommended. There are differences in manufacturers’ recommendations regarding the best time of the day for urine testing, and for best results these recommendations should be followed.

It is claimed that these rapid enzyme immunoassays have an accuracy of more than 90% for detecting the LH surge. Several studies have compared urinary LH kits for ovulation prediction to ultrasonographic changes of follicular collapse to establish their reliability. In one study using a rapid colorimetric enzyme immunoassay test once every evening, the mean (± standard error of the mean [SEM]) time from peak serum LH to positive urine LH was found to be 2 ± 2 hours (90% confidence interval −2 to 6); the mean time from positive urine LH to follicular collapse was 20 ± 3 hours (95% confidence interval 4 to 26).8 Positive predictive values for follicular collapse within 24 or 48 hours after positive urine LH testing were 73% and 92%, respectively. In another report, sonographic evidence of ovulation was detected by the first day after the LH surge (day 1) in 35% of 269 cycles studied and not until day 2 in an additional 61% of cycles.9

Two more recent studies confirm the accuracy of LH testing for ovulation documentation. Both studies used daily periovulatory transvaginal ultrasound to demonstrate the collapse of a mature follicle as evidence of ovulation. In the first study 100% correlation between urinary LH test and ultrasonographic diagnosis of ovulation was observed.10 In the second report, positive urinary LH test was observed in all 101 subjects tested, but follicular collapse occurred in only 97 subjects (96%). In three cycles (3%), the dominant follicle, after LH surge, did not show morphologic changes consistent with ovulatory event. Interestingly, in these women, midluteal serum progesterone levels were above 11 ng/mL. Thus, sensitivity, specificity, and accuracy for LH reading in this study were 1.00, 0.25, and 0.97, respectively. LH surge preceded rupture of dominant follicle in all cases. The temporal relation between urinary LH surge and ultrasonographic diagnosis of ovulation (day 0) showed, the urinary surge of LH occurred on day 0 in 10% of cycles, on day −1 in 46% of cycles, day −2 in 31% of cycles, and day −3 in 13% of cycles.11 These results are consistent with those of the World Health Organization (WHO) probit analysis that analyzed hormonal assessment of 107 women using laparotomy for diagnosing ovulation based on ovarian histology findings.12 The temporal relation between a positive home ovulation predictor LH Kit (Clear Plan One Step Test) and follicle rupture has been also studied in detail.13 The time from a positive result to rupture ranged from 24 to 28 hours (median, 32 hours) with testing and scan every 6 hours, and with daily early-morning urine testing, the range was 8 to 48 hours (median, 24 hours).

Thus, urinary LH kits, if used properly, are the most reliable method of ovulation prediction for home use. These kits are now widely used by patients and are recommended by physicians involved in the care of infertile couples for timing of coitus, artificial insemination, postcoital tests, and the like. However, their efficacy relative to improvement of fecundity remains to be established.14

Estrogen Assays

Serum E2 demonstrates a characteristic peak approximately 1 day before the LH surge and 37 hours before ovulation. Serial determinations of serum E2 at midcycle thus can detect the time of ovulation with a fair amount of accuracy. Rapid assays for serum E2 are available but require a specialized laboratory and are time-consuming and expensive. Urinary estrogen assays have been used for detection and timing of ovulation. The preovulatory peak of urinary estrogens ranges from 40 to 100 μg per 24 hours. The mean interval between the first observable rise and the estrogen peak is 5.5 days. The day after estrogen peak (day of LH surge) is believed to be the day of maximal fertility.

Direct assays of urinary metabolites of estrogens have been developed, and kits for self-detection of these metabolites are available. Three immunochemical tests have been developed, and their potential efficiency has been compared with results of other methods. The first method involves the measurement of estrone-3 glucuronide (E3G) in daily samples of early morning urine. The day of a defined rise in the concentration is used to indicate the start of the probable fertile period, and the peak day plus 4 is used to indicate the last day of potential fertility or the start of the infertile (postovulatory) period. The second test involves determining the ratio of E3G to pregnanediol-3α-glucuronide in a daily sample of early morning urine. Similar to the previous test, the day of a defined rise is used to identify the last day of potential fertility or the start of the infertile period.

The third test is designed to measure E3G and LH simultaneously. The kit (Unipath Research, Greenwich, CT) measures changes in LH and E3G levels in urine using antibodies specific to these hormones. It stores information on hormone level changes gathered over the last six cycles to take into account cycle variations among individual women. Results of a study of 625 cycles of 221 healthy women planning to become pregnant showed that virtually all the pregnancies that occurred could be attributed to intercourse during a 6-day period ending on the day of ovulation.15

These assays have been field-tested by a task force of the WHO, and the results indicate that the E3G test can predict ovulation and define the fertile period in 78% of menstrual cycles and that the ratio test can predict this in 74% (Fig. 2).16 A modification of the unipath test is the Clear Plan Fertility Monitor (CPFM). The system comprises a hand-held monitor and disposable dual-assay urine test sticks. The test sticks simultaneously detect LH and E3G in early morning urine. The LH assay is a classic sandwich assay and as the concentration of LH in the urine increases then the intensity of the line formed on the test stick increases. The E3G assay is a competition assay and as the concentration of E3G increases then the corresponding line intensity decreases. The monitor optically measures the intensity of the lines that form on the test sticks after sampling. The corresponding signal is measured in percentage transmission units (%T). As the concentration of LH increases the associated signal increases, as the concentration of E3G increases the associated signal decreases.

Fig. 2. A comparison of methods to predict the start and finish of fertile periods.(Collins WP: Biochemical approaches to ovulation prediction and detection and the location of the fertile period in women. In Jeffcoate SL [ed]: Ovulation: Methods for Its Prediction and Detection, p 49. New York, John Wiley & Sons, 1983.)

The system will delineate three levels of fertility according to changes detected in the concentrations of LH and E3G. Low fertility is displayed when the probability of conception is low and these hormones are at a baseline concentration. Low fertility will be displayed from day 1 of a women’s cycle until rises above the baseline concentrations are detected. The change from Low fertility to high fertility is triggered by detection of elevated E3G concentrations, typically at concentrations between 20 to 30 ng/mL. The display of high fertility indicates that the woman is approaching ovulation. High fertility is also displayed for 1 day after peak fertility. The change from high fertility to peak fertility is triggered by the detection of an LH surge, typically with a concentration more than 30 IU/L. The display of peak fertility indicates that ovulation is imminent. Peak fertility is displayed on the day of the LH surge (CPFM peak day) and on the following day. Subsequently, high fertility will be displayed for 1 day prior to a return to low fertility. The changes in fertility are displayed on the monitor’s liquid crystal display (LCD).17 The accuracy of CPFM in detecting ovulation and fertile period has been compared to those of serum LH, serum E2 and progesterone, as well as serial ultrasounds in several recent reports. These studies have established an excellent correlation between mid cycles rise of serum E2, LH surge, follicle rupture, and peak fertility determined by CPFM. In the study reported by Behre and associates,18 a total of 135 ovulatory cycles with 53 women with cycle lengths between 21 and 42 days were evaluated. Ovulation was detected in 91% of cycles during the 2 days of CPFM peak fertility and in 6% of cycles 1 day after peak fertility. Serum surge of LH occurred in 51% of cycles, 1 day and in 43% of cycles 2 days prior to follicular collapse as demonstrated by ultrasound.

These tests have the potential both of predicting ovulation and identifying the limits of the fertile period in healthy women with regular menstrual periods.

Progesterone Assays

The availability of radioimmunoassay (RIA) and, more recently, automated chemiluminescent assays of serum progesterone has considerably improved the accuracy and ease of documentation of ovulation. Serum progesterone levels are usually less than 1 ng/mL during the follicular phase. Coincident with the LH rise, serum progesterone begins to rise and reaches a peak of greater than 10 ng/mL approximately 8 days after the LH peak. A progesterone level greater than 5 ng/mL is considered to be consistent with ovulatory cycles by most investigators.19 Presumption of ovulation can be documented, therefore, by obtaining two blood samples on days 8 and 21 of a normal cycle. A rise of progesterone value from less than 1 ng/mL to greater than 5 ng/mL would be consistent with ovulation.

Urinary assay of pregnanediol, a metabolite of progesterone, also would aid in ovulation detection (see Fig. 1). In the midluteal phase, pregnanediol levels reach 4 to 6 mg per 24 hours.2 A urinary level of 2 mg or greater is thus consistent with ovulatory cycles. RIA or urinary pregnanediol-3α-glucuronide has demonstrated a significant rise of this metabolite in the urine 2 days after the LH peak.20 As previously indicated, the peak of the ratio of E3G to pregnanediol-3a-glucuronide plus 5 signals the start of the postovulatory period.15

Back to Top
TESTS BASED ON PERIPHERAL AND SYSTEMIC CHANGES

Basal Body Temperature

In 1904, van de Velde observed that body temperature obtained at basal level during the menstrual cycle shows a biphasic pattern. Monitoring of basal body temperature (BBT) has been found to be one of the simplest and most practical means of ovulation detection. In practice, women are instructed to take their oral, vaginal, or rectal temperatures with a basal thermometer every morning on awakening, before getting out of bed or doing any physical activity. A period of 6 to 8 hours of uninterrupted rest is deemed necessary before the temperature is obtained. The temperature record shows a typical biphasic pattern during ovulatory cycles; in anovulatory cycles it remains monophasic. A preovulatory dip (possibly coinciding with estrogen peak) is usually, but not invariably, observed.21

The WHO definition of changes in BBT indicates that a shift in BBT to the hyperthermia phase of the cycle should occur within a period of 48 hours or less. Three consecutive daily BBTs should be at least 0.36°F (0.2°C) higher than the previous six daily temperatures.21

In a study of 10 normal women, cyclic fluctuations of gonadotropins and ovarian steroids were simultaneously measured and correlated with the BBT. The mean BBT was 97.48°F ± 0.25° (36.37°C ± 0.12°) during the follicular phase and 98.09°F ± 0.22° (36.72°C ± 0.12°) in the luteal phase. The BBT began to rise simultaneously with the LH surge. A significant rise did not occur until 2 days after the LH peak. This coincided with the rise of serum progesterone to a mean level above 4 ng/mL and urinary pregnanediol to greater than 1.8 mg per 24 hours (see Fig. 1 and Fig. 3). After the rise, the BBT remained 98°F until serum progesterone declined below 4 ng/mL and urinary pregnanediol to less than 1.8 mg per 24 hours. The BBT rose significantly during midcycle above the follicular phase level and increased further to a highly significant degree during the luteal phase.2 These observations confirm that the rise of BBT precedes or coincides with ovulation and is associated with the increased production of progesterone by the ovary. The BBT record does not predict the day of ovulation but rather provides evidence of ovulation 2 or 3 days after it has occurred.2,21,22 Biphasic BBT is usually indicative of an ovulatory cycle, although a monophasic BBT may be observed in some ovulatory cycles.23,24 The reason for the absence of thermogenic response to ovulatory levels of progesterone in these cases is unknown. The rise in temperature is secondary to progesterone, and the primary reason for the rise is the increase in the production and secretion of norepinephrine, which is a thermogenic neural hormone.

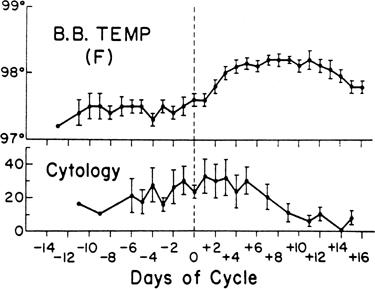
Fig. 3. Basal body temperature and karyopyknotic index of vaginal cytology throughout the menstrual cycle in 10 ovulatory women. Day 0 = day of luteinizing hormone surge (dotted line). Vertical bars represent one standard error of the mean.(Moghissi KS, Syner FN, Evans TN: A composite picture of the menstrual cycle. Am J Obstet Gynecol 114:405, 1972.)

The reliability of BBT to detect ovulation has been studied repeatedly. In a retrospective assessment of 210 biphasic BBT records, the thermal nadir occurred within 1 day of the urinary LH surge in 75% of the cases and in 90% within 2 days.25

In the prospective study reported by Guermandi and colleagues11BBT records were compared to LH, E2, and progesterone in the serum and follicular collapse demonstrated by daily ultrasound. BBT reading showed 0.77 sensitivity, 0.33 specificity, and 0.74 accuracy for ovulation documentation.

In infertility evaluation, the patient should be instructed to record her BBT during the entire course of the menstrual cycle for several months. This is done in an effort to document the occurrence as well as normalcy of the ovulatory process. A prolonged follicular phase and short luteal phase (less than 12 days’ duration) may be contributing factors to infertility.

Several computerized or digitalized BBT recording devices have been developed to identify the fertile period more accurately. The Thermodigital thermometer is a solid-state electronic oral thermometer that uses microcomputer-assisted, repeated calculations to give a digital LCD in 60 seconds. The Rabbit Computer Corporation (Los Angeles, CA) has developed a fertility indicator for home use called The Rabbit. This device uses BBT measurement and a built-in computer program to predict the preovulatory period by documenting prior cycle lengths. The device also has a built-in alarm to awaken the user and can visually graph out up to 12 prior cycles of BBT measurement.

Two other sophisticated, but rather expensive, devices available are the Rite Time (Rite Time Ltd., United Kingdom) and Fertil-A-Chron (Fertil-A-Chron Inc., Hauppauge, NY). The latter product incorporates an electronic digital oral probe and an alarm system to remind the user to take her BBT.

A device called Bioself Fertility Indicator (Bioself Distribution SA, Geneva, Switzerland) has been marketed for the purpose of integrating findings of BBT and menstrual cycle records.26 It consists of an electronic thermometer that registers the daily morning temperature, as well as the first day of each menstrual cycle. A unique algorithm programmed into the microprocessor chip calculates when the temperature shifts from the lower to the higher level after ovulation. The method is based on a calculation involving the observation of about six menstrual cycles and the deduction of 18 days from the shortest cycle and 9 days from the longest. The interval between these two points represents the fertile period of the following cycles. The use of this device as a contraceptive in field trials has been reported to result in a pregnancy rate of 9 per 100 women year and the 1-year discontinuation of 32.5%.27 Another device, the Ovudate fertility test kit (Franklin Diagnostics Inc., Morristown, NJ), measures core temperature using a first morning urine sample.

Royston,28 in collaboration with a WHO task force, has shown that a modified form of cumulative sum test (CUSUM), a method commonly used in industrial quality control to detect drift away from a preset target value, may be used as a sensitive and reasonably reliable method for picking up a signal represented by a change in the mean level of serial hormone or BBT readings. By a simple extension, one can also find peak values that correspond approximately to ovulation. Distinctive and valuable features of the CUSUM analysis are that it may be used prospectively in the current cycle to monitor changes as they occur, and it may be applied to detect ovulation electronically.

Tests Based on Cervical Mucus

Secretion of cervical mucus is regulated by ovarian hormones. Estrogen stimulates the production of large amounts of thin, watery, alkaline, acellular cervical mucus with intense ferning, spinnbarkeit, and sperm receptivity. Progesterone inhibits the secretory activity of cervical epithelia and produces scanty, viscous, cellular mucus with low spinnbarkeit 
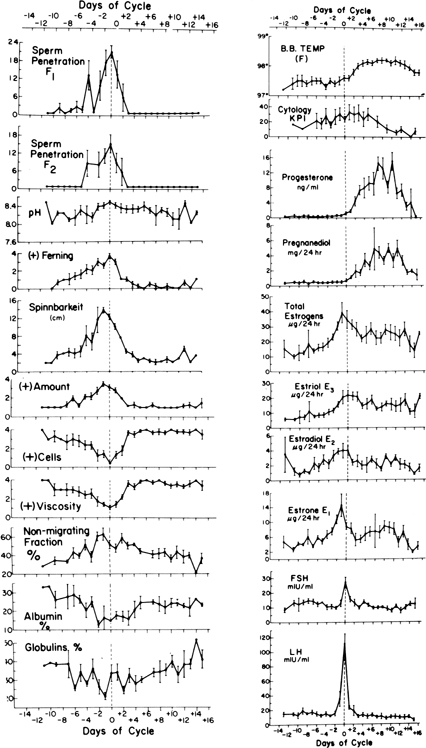
and absence of ferning, which is impenetrable by spermatozoa.

Changes of various properties of cervical mucus related to gonadotropins and sex steroids during a normal menstrual cycle in 10 women are shown in Figure 1. The preovulatory peak of urinary estrogen coincides with cervical mucorrhea exhibiting high spinnbarkeit and ferning, low cell count, and viscosity. The lowest value for albumin and globulin, the highest percentage of mucin (electrophoretically nonmigrating fraction), and the greatest volume of mucus and spinnbarkeit precede the rise of LH and occur simultaneously with the estrogen peak. The lowest cell count, maximal ferning, and sperm penetration coincide with the midcycle surge of LH the day after the preovulatory estrogen peak. Other investigators have repeatedly confirmed these observations.

Changes in the appearance of the cervix and physical properties and chemical constituents of cervical mucus form the basis for many tests commonly used to determine the time of ovulation. These include the appearance of the cervix, midcycle mucorrhea, crystallization (ferning), spinnbarkeit, viscosity or consistency, and cyclic changes of various constituents of cervical mucus.

The appearance of the cervix varies during the menstrual cycle. In midcycle, the cervix softens progressively, the os dilates, and clear, profuse mucus exudes from the os. Within a few days after ovulation, the cervix becomes firm and the os is closed and covered by scanty, turbid, tenacious mucus.

Women can be taught to palpate the cervical os, inspect it through a speculum daily, and examine the cervical mucus and detect by this means the ovulatory period.29 Billings and coworkers30 reported that women who were adequately instructed were able to predict and identify the approximate time of ovulation by recognizing increased midcycle mucous discharge, which occurred at about the time of ovulation. In 22 subjects, the authors measured plasma LH and urinary total estrogens and pregnanediol daily in midcycle to provide a hormonal estimate of the day of ovulation. A characteristic lubricative mucus identified by all the women occurred from 2 days before to the day of ovulation. The onset of perceptible mucorrhea occurred 6.2 days (mean) before ovulation. The authors concluded that the time of ovulation could be identified clinically by recognizing increased midcycle mucous discharge. Hilgers and associates31 confirmed that ovulation was estimated to occur from 3 days before to 3 days after the peak mucous symptoms, with a mean of 0.31 days before the peak symptoms.

Midcycle mucorrhea, ferning, spinnbarkeit, and lowered cell content and viscosity of cervical mucus are used commonly in ovulation detection and as an index of estrogenic response of the cervical epithelium. However, these changes extend over several days (see Fig. 1). Only rarely do favorable changes in cervical mucus occur abruptly and persist for only 1 to 2 days in the cycle.32 Hence, to determine the time of ovulation by this means, serial observations would have to be made during midcycle. Intense ferning, high spinnbarkeit, and low consistency do not necessarily indicate ovulation and are merely an index of an optimal amount of circulating estrogen that may be also observed in anovulatory cycles. Changes in cervical mucus in the opposite direction indicate a postovulatory progesterone effect. In the presence of endocervicitis, assessment of cervical mucus may be difficult or impossible.

SPINNBARKEIT OR FIBROSITY.

This refers to the capacity of cervical mucus to be drawn into threads. The simplest technique for performing this test consists of stretching an adequate amount of cervical mucus between a glass slide and a coverslip. The length of the mucous thread is measured in centimeters just before it breaks. Alternatively, the mucous sample may be aspirated into a capillary tube; the tube is broken and the ends drawn slowly apart against a scale marked in centimeters until the mucous thread parts (Fig. 4).

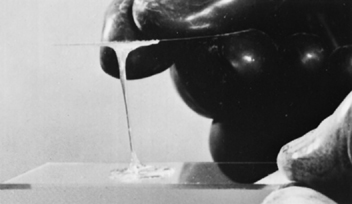
Fig. 4. Technique of evaluating spinnbarkeit of cervical mucus.

FERNING OR CRYSTALLIZATION.

Papanicolaou discovered the fact that cervical mucus, when spread on a glass slide and allowed to dry, exhibited an intriguing pattern of arborization with crystallization. He also observed the relation between crystallization and estrogen activity. Ferning results where true crystals of sodium and potassium chloride form around a small and optimal amount (1% to 15%) of organic matter. Ferning appears between days 8 and 10 of a typical cycle and peaks at ovulation. Immediately after ovulation, it decreases or disappears (Fig. 5).

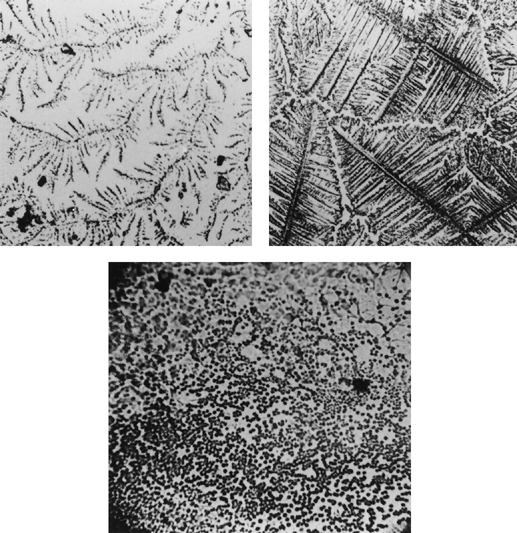
Fig. 5. Ferning (crystallization) of cervical mucus. Preovulatory ferning (top right), atypical ferning (top left), and absent ferning (bottom).

Back to Top
CONSISTENCY (VISCOSITY)

Changes in the viscoelastic properties of cervical mucus during the menstrual cycle have been used to detect the time of ovulation. Kopito and Kosasky33 developed a rheometer that measures the tackiness of cervical mucus. With the aid of a disposable grid plate (Ovutime Fertility Detection System; Ovutime, Chestnut Hill, MA), these investigators measured the viscoelastic properties of cervical mucus. The lowest reading coincided with the LH surge. This is consistent with the observations of Moghissi and associates.2 The value of recording cervical mucus viscosity for ovulation detection has been confirmed by other investigators.34

CERVICAL SCORE.

Insler and coworkers35 have devised a cervical score to monitor the ovulation time. In this system, the quantity, spinnbarkeit, and ferning capacity of cervical mucus and the appearance of the external os are assessed clinically. A 4-point score (0 to 3) is given to all parameters except for the appearance of the external os, which is estimated by a 3-point score (0, 2, and 3). The sum of scores provides the total cervical score. Immediately before ovulation, a score of 10 to 12 is usually expected.

A different scoring system devised by Moghissi36 assigns a score of 0 to 3 to 5 different properties of cervical mucus (amount, ferning, spinnbarkeit, viscosity, and cellularity). A total score of 13 to 15 is indicative of preovulatory mucus and the approach of ovulation.

The cervical mucus score has been found to be a reliable indicator of follicular development and rupture and correlates highly with ultrasonography.37,38,39

BURN TEST (CARAMEL TEST).

In this test, the mucus is spread over a glass slide and allowed to dry. The material is then heated over a flame (alcohol lamp) for approximately 1 minute. The slide is viewed against the light. Light or dark brown indicates a lack of crystallization and denote early follicular phase or luteal phase mucus; a transparent color is consistent with the preovulatory crystallization pattern.

Tests Based on Chemical Contents of Cervical Mucus

Cervical mucus consists of 92% to 95% water. Inorganic salts in the mucus amount to 1%, of which the principal constituent is sodium chloride. Traces of potassium, magnesium, calcium, copper, phosphates, sulfates, and bicarbonate are also present. Low molecular organic compounds present include free simple sugars (glucose, maltose, mannose), amino acids, proteins, enzymes such as alkaline phosphatase, esterase, aminopeptidase, amylase, and certain components of fibrinolytic enzymes. Cervical mucin, a carbohydrate-rich glycoprotein, is the most important constituent of cervical mucus. Most of the physical and biological characteristics of cervical secretion are due to mucin. In the search for a simple method for ovulation detection, many tests have been devised based on the determination of various constituents of cervical mucus.

PROTEIN CONSTITUENTS.

Soluble proteins such as albumin,32 α1-antitrypsin,40 and immunoglobulins (Ig) A and G show a significant decrease immediately before, or simultaneously with, the time of ovulation. Mucins exhibit a marked increase at this time.32 Current methods for determining these proteins are based on electrophoretic or immunologic techniques and are not as yet of clinical value.

Back to Top
ENZYMES

Many enzymes have been identified in human cervical mucus.41 Most of them show a cyclic pattern, so their determination may prove to be of value in timing ovulation. These include muramidase (lysozyme), α-amylase alkaline phosphatase, aminopeptidase, esterase, lactate dehydrogenase, and guaiacol peroxidase. The concentration of many of these enzymes is high during the follicular phase and decreases precipitously prior to ovulation.42 On the day after the LH surge, there is a significant and sudden increase in the concentration of these enzymes, which is sustained during the luteal phase.

Determination of some of these enzymes is simple enough to be of clinical value and merits further investigation.

Sodium Chloride, Sialic Acid, and Volume

A positive fern test that appears when midcycle cervical mucus is left to dry on a glass slide depends on the crystallization of sodium chloride in the presence of biological fluids containing optimal amounts of certain organic substances. The sialic acid concentration also decreases during the proliferative phase of the cycle, reaching a trough at ovulation, and increases after ovulation.43

The volume of cervical mucus increases significantly at midcycle.43 Based on this principle, Usula and Schumacher44 developed the ovumeter, a modified syringe that is inserted deep into the vagina, near the cervix, and then filled. Ovulation can be predicted by charting the fluid volume aspirated versus the day of the cycle and applying an algorithm. Reported accuracy is approximately 75%, and the cost is minimal.

Potential difficulties exist with all techniques requiring self-sampling of cervical mucus because of an absence of an effective device for mucus collection, the inability of some women to sample their own cervical mucus, and biologic variability.

Endometrial Biopsy

Endometrial secretory activity during the luteal phase is usually indicative of ovulation and corpus luteum formation. Dating of an endometrial biopsy, when performed by an experienced observer, is reliable within 1 to 2 days but is only of retrospective value. A good correlation has been observed between corpus luteum and endometrial dates and the time of BBT nadir, estradiol peak, and midcycle surge of LH.45

Vaginal Cytology

Papanicolaou described the variation in human vaginal smears during the menstrual cycle. A correlation between vaginal smear changes and the BBT curve and cyclic hormonal changes during the menstrual cycle has been established. Studies correlating variations in vaginal cytology with serum gonadotropins and progesterone and urinary estrogens and pregnanediol have shown that the karyopyknotic index of vaginal cells increases gradually to midcycle and peaks on the day after the LH surge (see Fig. 1 and Fig. 2).2 Thereafter, there is a steady decline of the index to the end of the menstrual cycle, when it reaches levels below those in the early proliferative phase. The mean peak of the index is reached 2 days after the total estrogen peak. This lag period is probably required before the vaginal epithelium responds to increased estrogenic stimulation. Because the peak of urinary estrogens precedes the LH surge by 1 day1,2,3 and ovulation is presumed to occur within 24 hours after the surge,5,6 it follows that the peak of the index of the vaginal cells coincides with ovulation. With the development of more sophisticated methods of ovulation detection such as urinary LH testing, this method has lost its appeal.

Saliva

Saliva is readily available for sampling, both by the physician and by the patient. Many constituents of saliva have been studied and their relation to menstrual cycle and ovulation has been determined. They include proteins, amino acids, urea, mucin, sialic acid, sugars, electrolytes, citric acid, and enzymes such as amylase and alkaline phosphatase. Most of these constituents bear no precise relation to the time of ovulation. The alkaline phosphatase levels of saliva generally increase at ovulation and decrease afterwards. A technique for measuring the alkaline phosphatase level in saliva, using a paper strip indicator, has been reported but remains to be confirmed. The N-acetyl-β-d-glucosamine concentration in saliva apparently shows cyclic changes during the menstrual cycle.46

Salivary ferning similar to cervical mucus ferning has been reported to be effective in predicting the time of ovulation.47

An exciting development is the establishment of exquisitely sensitive immunoassays to measure small amounts of steroids found in the saliva. Approximately 5% of estrogens in the circulation are in an unbound form and diffuse into all intracellular and intercellular fluids, including those that are secreted. A nearly identical situation exists for most steroids.

Relatively small quantities, 0.3 to 11 pg/mL (1 to 50 pmol/L), of free E2 are found by immunoassay of the unchanged steroid in saliva. The levels fluctuate during the cycle in a pattern roughly paralleling that of E2 in serum (Fig. 6).48,49,50,51 Quantitation of free progesterone in saliva by similar methods indicates a range of 23 ± 2 pg/mL (74 ± 6 pmol/L) in the follicular phase to 112 ± 40 pg/mL (355 ± 126 pmol/L) in the midluteal phase. This is still only 1% to 2% of the total progesterone measurable in serum. The pattern of progesterone in saliva faithfully mimics that seen in serum (see Fig. 6).48,49,50,51

Fig. 6. Estradiol and progesterone levels in saliva from seven normal menstrual cycles (mean ± standard error of the mean [SEM]), related to day of urinary luteinizing hormone surge (day 0).(Jeffcoate SL: Use of rapid hormone assays in the prediction of ovulation. In Jeffcoate SL [ed]: Ovulation: Methods for its Prediction and Detection, p 67. New York, John Wiley & Sons, 1983.)

The rate of saliva production seems to decrease at night in most persons. Fortunately, most of the assays for salivary steroids have proven to be insensitive to the salivary flow rate.46 In practice, citric acid may be applied to the tongue to increase the flow rate of saliva and decrease the time required for collection. The presence of serum contamination in saliva resulting from gum bleeding is a potential problem and can be minimized by rinsing the mouth before sample collection.

Back to Top
ULTRASOUND

Serial real-time pelvic ultrasonography has been described as a rapid, reliable method for monitoring follicular growth, rupture, and regression. This approach provides good presumptive, but not definitive, evidence of ovulation. Transverse and longitudinal scans are performed on both ovaries and the mean diameter of each follicle is calculated. Ovulation is deemed to have occurred if the follicle reached a mean diameter of 18 to 25 mm and subsequently changed in size, shape, or sonographic density. The changes in ultrasound image of the follicle that rupture are: (1) disappearance or sudden decrease in size, (2) increased echogenecity, (3) irregularity of follicular wall, and (4) appearance of free fluid in the cul de sac of Douglas. Disappearance or sudden decrease in follicle size has been found to be the most frequent sign of ovulation52; sensitivity and specificity of ultrasonography to document ovulation is 84% and 89%, respectively, and accuracy is about 85%. Potential sources of error consist of the possibility of an oocyte being retained by an apparently ruptured and collapsed follicle and regression of an unruptured follicle, as a result of inappropriate hormonal stimulation. In the studies reported by Kerin,53 the diameter of the dominant follicle increased from 12 to 23 mm over the 5 days preceding ovulation, and the range of diameter of follicles at ovulation was 18 to 29 mm. This relatively large range makes it difficult to predict the day of ovulation prospectively. A similar linear relation between follicle diameter and plasma E2 levels was reported by Bryce and coworkers,54 but the variation within and between the two parameters was too large to predict ovulation to within less than 1.4 ± 1.2 days.

The introduction of transvaginal ultrasound has considerably improved the sensitivity of this technique for ovulation detection. Vermesh and associates55 compared the accuracy of daily transvaginal ultrasound to those of serum and urinary LH, serum E2, and BBT. They found that transvaginal ultrasound detected ovulation, defined by disappearance of the dominant follicle, in all 31 cycles studied. A urinary LH kit called First Response (Carter Products, Carter-Wallace Inc., New York, NY) predicted ovulation in 53.3% of the cycles; another one, Ovustick (Quidel, San Diego, CA), did so in 87.5% of the cycles. The BBT nadir predicted the day of ovulation in only 10% of cycles. This study documents the fact that transvaginal ultrasound is an excellent method for detection of ovulation, and the BBT has only a retrospective, rather than predictive, value for detection of ovulation.

Collectively, the studies reported thus far indicate that ultrasound recording of follicular size is a useful adjunct or reference method for the timing of ovulation.9 Serial ultrasound determination is expensive. Current practice is to use other methods of ovulation timing and to perform two or three ultrasonic measurements of follicular size close to the time of ovulation to confirm follicular maturation or collapse.

Back to Top
OTHER METHODS

The blood basophil count has been found to decrease significantly on the day of ovulation; this change did not occur in anovulatory cycles.56 Similarly, the value of the leukocyte alkaline phosphatase relative score, based on the degree of intensity and quantity of the precipitated dye within the cytoplasm of stained segmented and band-form neutrophilic granulocytes, has been found to correlate closely with the LH surge and the preovulatory urinary estrogen surge.34 Further studies have shown that the leukocyte alkaline phosphatase relative score peak occurred either 1 day before or on the day of the LH surge. Effective use of these methods requires serial blood sampling, which would make their usefulness somewhat limited.

Measurements of salivary and vaginal electrical resistance have also been evaluated for predicting and confirming ovulation. A device called the CUE Fertility Monitor (Zetek Inc., Aurora, CO) has been developed to measure the electrical resistance of vaginal mucus and saliva. The instrument is a battery-operated device with a digital readout that indicates the measured resistance at the sensors. In recent decades, a number of studies have been conducted to determine the usefulness and accuracy of CUE ovulation predictor. These studies used either LH surge in the serum or urine as a comparison marker of ovulation. Taken together, these studies indicate that the accuracy of CUE ovulation predictor in identifying the fertile period (preiovulatory) is similar to cervical mucus method,57 but further field trials will be needed to test the reliability and sensitivity of the device in ovulation timing.

With rapid technological progress and new insight into the intricate process of reproduction, new markers of ovulation and the fertile period will undoubtedly be identified. Among these markers, some have already been investigated and techniques for their detection and validation are being tested. Inhibin or folliculostatin, a nonsteroidal protein substance produced by the granulosa cells of the ovary, shows a progressive increase during follicular development and may be a useful marker. Levels of follicle-regulating protein, which is also produced by the granulosa cells, rise progressively both in blood and urine during the menstrual cycle. The rise begins about 6 days before the day of the LH surge, with a further rise in the luteal phase.58

Back to Top
CONCLUSION

Numerous methods are now available to predict or document ovulation. For clinical purposes, studies of BBT and the biophysical and biochemical constituents of cervical mucus and urinary LH appear to be the most practical methods of ovulation detection.

The availability of enzym immunoassay kits and their more extensive use have improved the reliability of these clinical techniques. The development of rapid and easy-to-use steroid assay kits for the measurement of urinary and salivary estrogen and progesterone or their metabolites may further improve the precision of ovulation timing. A better understanding of the hormonal and biochemical events associated with ovulation and rapid technological advances are expected to lead to the development of more precise methods of ovulation detection and prediction. Serial ultrasound evaluation of follicular development is an excellent albeit invasive and expensive method of ovulation documentation, which by many clinician is considered to be at this time the gold standard procedure for this purpose.

Back to Top
REFERENCES

1. Abraham GE, Odell WD, Swerdloff RS: Simultaneous radioimmunoassay of plasma FSH, LH, progesterone, 17-hydroxyprogesterone and estradiol-17b during the menstrual cycle. J Clin Endocrinol 34:312, 1972

2. Moghissi KS, Syner FN, Evans TN: A composite picture of the menstrual cycle. Am J Obstet Gynecol 114:405, 1972

3. Speroff L, Vande Wiele RL: Regulation of the human menstrual cycle. Am J Obstet Gynecol 109:234, 1971

4. Yen SCC, Vela P, Ramkin J, Littel AS: Hormonal relationship during the menstrual cycle. JAMA 211:1513, 1970

5. Yussman MA, Taymor MI, Miyata J, et al: Serum levels of follicle-stimulating hormone, luteinizing hormone, and plasma progestins correlated with human ovulation. Fertil Steril 21:119, 1970

6. Pauerstein CJ, Eddy CA, Croxatto DH, et al: Temporal relationships of estrogen, progesterone and luteinizing hormone levels to ovulation in women and in infrahuman primates. Am J Obstet Gynecol 130:876, 1978

7. World Health Organization: Temporal relationships between ovulation and defined changes in the concentration of plasma estradiol-17b luteinizing hormone, follicle-stimulating hormone and progesterone. I. Probit analysis Am J Obstet Gynecol 138:383, 1980

8. Miller PB, Soules MR: The usefulness of a urinary LH kit for ovulation prediction during menstrual cycle of normal women. Obstet Gynecol 87:13, 1996

9. Pearlstone AC, Surrey ES: The temporal relation between the urine LH surge and sonographic evidence of ovulation: Determinant and clinical significance. Obstet Gynecol 83:184, 1994

10. Guida M, Tommaselli GA, Palomba S, et al: Efficacy of methods for determining ovulation in natural family planning program. Feril Steril 72:900, 1999

11. Guermandi E, Vegetti W, Bianchi MM, et al: Reliability of ovulation tests in infertile women. Obstet Gynecol 97:92, 2001

12. World Health Organization, Task Force on Methods for Determination of the Fertile Period, Special Programme of Research Development and Research Training in Human Reproduction: Temporal relationships between ovulation and defined changes in the concentration of serum estradiol-17 beta, luteinizing hormone, follicle stimulating hormone and progesterone I, Probit Analysis. Am J Obstet Gynecol 138:383, 1980

13. Collins W: Indicators of potential fertility: scientific principles. In Bannar J (ed): Natural Conception Through Personal Hormone Monitoring, pp 13–33. New York, Parthenon Publishing Group, New York, 1996

14. Corson GH, Ghazi D, Kemmann E: Home urinary luteinizing hormone immunoassays: Clinical applications. Fertil Steril 53:591, 1990

15. Collins WP: Biochemical approaches to ovulation prediction and detection and the location of the fertile period in women. In Jeffcoate SL (ed): Ovulation: Methods for Its Prediction and Detection. p 49, New York, John Wiley & Sons, 1983

16. Wilcox AJ, Weinberg ER, Baird DD: Timing of sexual intercourse in relation to ovulation. Effects on the probability of conception. Survival of pregnancy and sex of the baby N Engl J Med 333:1517, 1995

17. Tanabe K, Susumu K, Hand K, et al: Prediction of potentially fertile period by urinary hormone measurements using a new home-use monitor: comparison with laboratory hormone analyses. Hum Reprod 16:1619, 2001

18. Behre HM, Kuhlage J, Gassner C, et al: Prediction of ovulation by urinary hormone measurements with the home use Clear Plan Fertility Monitor: Comparison with transvaginal ultrasound scans and serum hormone measurements. Hum Reprod 15:2478, 2000

19. Ross GT, Cargille CM, Lipsett MB, et al: Pituitary and gonadal hormones in women during spontaneous and induced ovulatory cycles. Recent Prog Horm Res 26:1, 1970

20. Samarajeewa P, Cooley G, Kellie AE: The radioimmunoassay of pregnanediol-3α-glucuronide. J Steroid Biochem 11:1165, 1979

21. Vollman RF: The Menstrual Cycle. Philadelphia, WB Saunders, 1977

22. Morris NM, Underwood LE, Easterling W: Temporal relationship between basal body temperature nadir and luteinizing hormone surge in normal women. Fertil Steril 27:780, 1976

23. Johansson EDB, Larson-Cohn U, Gemzell C: Monophasic basal body temperature in ovulatory menstrual cycles. Am J Obstet Gynecol 113:993, 1972

24. Moghissi KS: Accuracy of basal body temperature for ovulation detection. Fertil Steril 27:1415, 1976

25. Martinez AR, vanHoof HA, Shoute E, et al: The reliability, acceptability and applications of basal body temperatures (BBT) records in the diagnosis and treatment of infertility. Eur Obstet Gynecol Repro Biol 47:121, 1992

26. Flynn A, Pulcarno J, Royston P, et al: An evaluation of the Bioself 110 electronic fertility indicator as contraceptive aid. Contraception 44:125, 1991

27. Drouin J, Guilbert EE, Desaulniers G: Contraceptive application of the Bioself fertility indicator. Contraception 50:229, 1994

28. Royston JP: Statistical approach to the prediction and detection of ovulation: Detecting the signal among the noise. In Jeffcoate SL (ed): Ovulation: Methods for Its Prediction and Detection. p 19, New York, John Wiley & Sons, 1983

29. Keefe EF: Self-observation of the cervix to distinguish days of possible fertility. Bull Sloane Hosp Women 8:129, 1962

30. Billings EL, Billings JJ, Brown JB, et al: Symptoms and hormonal changes accompanying ovulation. Lancet 1:282, 1972

31. Hilgers TW, Abraham GE, Cavanaugh D: Natural family planning. I. The peak symptom and estimated time of ovulation Obstet Gynecol 52:575, 1978

32. Moghissi KS: Cyclic changes of cervical mucus in normal and progestin treated women. Fertil Steril 17:663, 1966

33. Kopito LE, Kosasky HJ: The tackiness rheometer determination of the viscoelasticity of cervical mucus. In Hafez ESE (ed): Human Ovulation. p 351, Amsterdam, North Holland, 1979

34. Lotan Y, Diamant YZ: The value of simple tests in the detection of human ovulation. Int J Gynaecol Obstet 16:309, 1979

35. Insler V, Melamed H, Eichenbrenner I, et al: The cervical score: A simple semiquantitative method for monitoring of the menstrual cycle. Int J Fertil 10:223, 1972

36. Moghissi KS: The cervix in infertility. Clin Obstet Gynecol 22:27, 1979

37. Abidogun KA, Ojengbede OA, Fatukasi UI: Prediction and detection of ovulation: an evaluation of the cervical mucus score. Afr J Med Sci 22:65, 1993

38. Templeton AA: Relation between the luteinizing hormone peak, the nadir of the basal body temperature and the cervical mucus score. Br J Obstet Gynaecol 89:985, 1982

39. Leader A, Wiseman D, Taylor PJ: The prediction of ovulation: A comparison of the basal body temperature graph, cervical mucus score, and real-time pelvic ultrasonography. Fertil Steril 43:385, 1985

40. Schumacher GFB, Yang SL: Cyclic changes of immunoglobulins and specific antibodies in human and rhesus monkey cervical mucus. In Insler V, Bettendorf G (eds): The Uterine Cervix in Reproduction. p 187, Stuttgart, Thieme, 1977

41. Treves C, Vincenzini MT, Vanni P, et al: Changes in enzyme levels in human cervical mucus during the menstrual cycle. Int J Fertil 3:59, 1986

42. Tsibris JCM, Lagenberg PW, Khan-Dawood FS, et al: Cervical-vaginal peroxidases sex hormone control and potential clinical use. Fertil Steril 44:236, 1985

43. Moghissi KS, Syner FN: Cyclic changes in the amount of sialic acid of cervical mucus. Int J Fertil 21:246, 1976

44. Usula SJ, Schumacher GFB: Volumetric self-sampling cervicovaginal fluid: A new approach to ovulation timing. Fertil Steril 39:304, 1983

45. Lundy LE, Lee SG, Levy W, et al: The ovulatory cycle: A histologic, thermal steroid and gonadotropin correlation. Obstet Gynecol 44:14, 1974

46. Rosado A, Delgado NM, Velasquez A, et al: Cyclic changes in salivary activity of N-acetyl-b-D-glucosamine. Am J Obstet Gynecol 128:560, 1977

47. Barbato M, Pandolf A, Guida M: A new diagnostic aid for natural family planning. Adv Contracept 9:335, 1993

48. Belkien LD, Bordt J, Moller P, et al: Estradiol in saliva for monitoring follicular maturation in an in vitro fertilization program. Fertil Steril 44:322, 1985

49. Jeffcoate SL: Use of rapid hormone assays in the prediction of ovulation. In Jeffcoate SL (ed): Ovulation: Methods for Its Prediction and Detection. p 67, New York, John Wiley & Sons, 1983

50. Campbell KL: Methods of monitoring ovarian function and predicting ovulation: Summary of a meeting. Res Front Fertil Regul 3:1, 1985

51. Riad-Fahmy D, Read GF, Walker RF, Griffiths K: Steroids in saliva for assessing endocrine function. Endocr Rev 3:367, 1982

52. Ecochard R, Marret H, Rabilloud M, et al: Sensitivity and specificity of ultrasound indices of ovulation in spontaneous cycles. Eur J Obstet Gynecol Reprod Biol 91:59, 2000

53. Kerin J: Ovulation detection in the human. Clin Reprod Fertil 1:27, 1982

54. Bryce RL, Shutter B, Sinosich MJ, et al: The value of ultrasound, gonadotropin and estradiol measurements for precise ovulation prediction. Fertil Steril 37:42, 1982

55. Vermesh M, Kletzky OA, Davajan V, et al: Monitoring technique to predict and detect ovulation. Fertil Steril 47:259, 1987

56. Mettler L, Shirwani D: Direct basophil count for timing ovulation. Fertil Steril 25:718, 1974

57. Fehring RJ: A comparison of the ovulation method with the CUE ovulation predictor in determining the fertile period. J Am Acad Nurs Pract 8:461, 1996

58. Katt E, Fujimori K, Yanagihara D, et al: Determination of follicle regulatory protein levels in urine during the normal menstrual cycle using an enzyme-linked immunoabsorbent assay. J Clin Endocrinol Metab 66:1213, 1988

Back to Top