Uterus Normal myometrium in women not on oral contraceptives demonstrates an increase
in T1 and T2 relaxation times in the secretory phase of the menstrual
cycle. On more T2-weighted images, an increase in signal intensity
is evident. The appearance of the myometrium in women on oral contraceptives
is one of higher signal intensity on T2-weighted images, whereas
the endometrial tissue is markedly reduced.12 Women taking higher doses of oral contraceptives demonstrate a larger
degree of myometrial swelling and endometrial atrophy. It is thought that
there is a greater water content in the myometrium during the mid-secretory
phase and that there is an increase in the T1 and T2 relaxation
times, resulting in increased signal intensity on T2-weighted images
and decreased intensity on T1-weighted images. Knowing the normal myometrial characteristics of the uterus allows identification
of pathologic alterations such as leiomyomas, a common gynecologic
disorder (Fig. 4). Simple myomas tend to be of low signal intensity regardless of the pulse
sequence used.13 They are usually surrounded by a smooth capsule also of low signal intensity. When
compared with ultrasonography or hysterosalpingography, MRI
is more accurate in detecting the presence, size, number, and location
of leiomyomas.14 In patients with menorrhagia or infertility secondary to submucosal leiomyomas, MRI
may be useful in optimizing patient management. In patients
undergoing myomectomies to restore fertility, MRI before the procedure
may help in planning the extent of surgery. 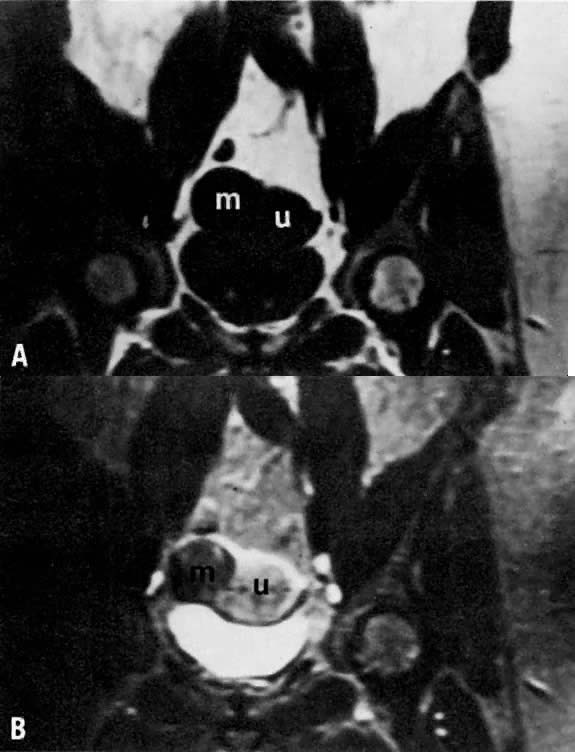 Fig. 4. A. Leiomyoma. Coronal T1-weighted image of an 81-year-old woman with a pelvic
mass. On both clinical examination and ultrasonography, distinction
between an ovarian and uterine mass could not be made. On this sequence, both
the leiomyoma ( m) and uterus ( u) have approximately the same signal intensity. B. T2-weighted image shows the leiomyoma ( m) to have decreased signal intensity when compared with the uterus ( u ). Fig. 4. A. Leiomyoma. Coronal T1-weighted image of an 81-year-old woman with a pelvic
mass. On both clinical examination and ultrasonography, distinction
between an ovarian and uterine mass could not be made. On this sequence, both
the leiomyoma ( m) and uterus ( u) have approximately the same signal intensity. B. T2-weighted image shows the leiomyoma ( m) to have decreased signal intensity when compared with the uterus ( u ).
|
Leiomyomas have various appearances depending on the presence or absence
of calcium, hyaline or cystic degeneration, and hemorrhage.15 In the presence of cystic degeneration, the leiomyoma demonstrates increased
T1 and T2 relaxation times, whereas the degenerative area itself
has low signal intensity on T1-weighted images and high signal intensity
on T2-weighted images. Hemorrhage within the leiomyoma, however, produces
various appearances, depending on the imaging sequence used, and
can make the diagnosis of leiomyoma more difficult.16 Several investigators have explored MRI of uterine sarcomas. Although MRI
demonstrates the presence of these massive lesions and the degree of
myometrial invasion, the overall findings are nonspecific, and differentiation
from endometrial carcinoma is difficult.17, 18 Adenomyosis is a relatively common condition occurring in approximately 15% to 25% of
women in the premenopausal period. It leads to progressively
heavier and longer menstrual periods and is often associated with
severe dysmenorrhea. The diagnosis is typically made after hysterectomy
from pathologic specimens. MRI has been used to evaluate this condition.19, 20 On imaging, uteri with adenomyosis are enlarged and have smooth external
configurations. Diffuse adenomyosis distorts the normal zonal anatomy
of the uterus, causing enlargement of the junctional zone (Fig. 5). Although predominantly isointense with myometrium on T1-weighted images
and decreased in signal on T2-weighted images, old hemorrhagic areas
measuring a few millimeters in diameter are often seen as high-intensity
spots on both T1-weighted and T2-weighted images. In contrast to
leiomyomas, which have well-circumscribed margins, adenomyosis has irregular
and indistinct margins because of its more invasive nature. Mark
and colleagues reported on 21 patients with suspected adenomyosis.20 MRI correctly diagnosed all eight cases of adenomyosis subsequently confirmed
by pathology. In a series of 93 patients with uterine enlargement, Togashi
and associates used MRI to correctly diagnose the 71 cases
of leiomyomas, 15 of 16 cases of adenomyosis, and all 6 cases of simultaneous
involvement of both conditions.21 Because adenomyosis is often treated by hysterectomy but myomectomy may
be sufficient for some leiomyomas, such imaging may be a very useful
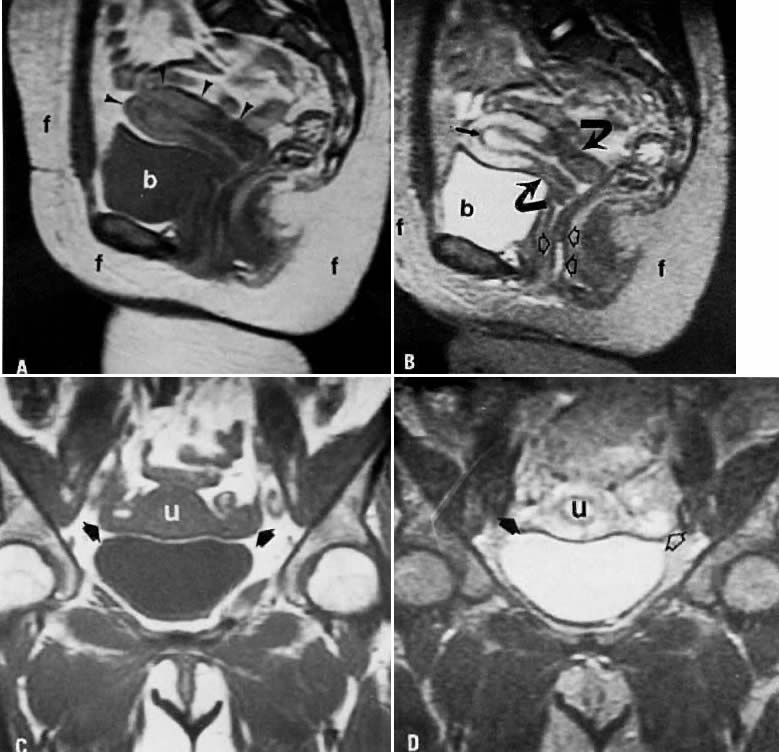
clinical tool for preoperative assessment and surgical planning. 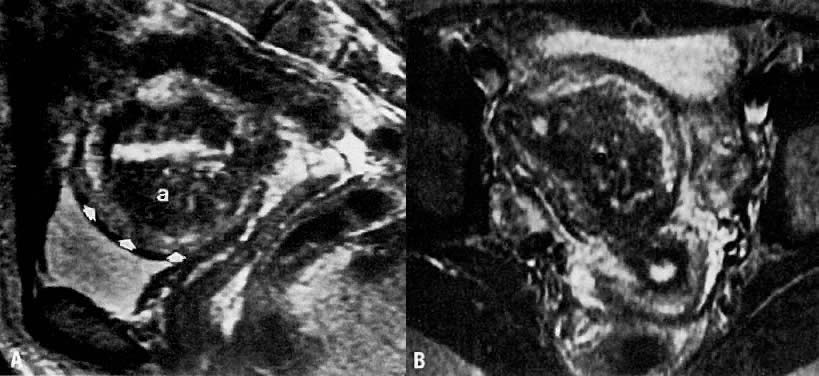 Fig. 5. A. Adenomyosis. Sagittal T2-weighted image of adenomyosis ( a) seen as an irregular, hypoin-tense, enlarged junctional zone with indistinct
margins infiltrating into the myometrium ( arrowheads ). B. Transverse T2-weighted image of the same patient showing adenomyosis ( a ). ( A and B courtesy of Dr. Leslie Scoutt, Yale University) Fig. 5. A. Adenomyosis. Sagittal T2-weighted image of adenomyosis ( a) seen as an irregular, hypoin-tense, enlarged junctional zone with indistinct
margins infiltrating into the myometrium ( arrowheads ). B. Transverse T2-weighted image of the same patient showing adenomyosis ( a ). ( A and B courtesy of Dr. Leslie Scoutt, Yale University)
|
Endometrium MRI is particularly useful for assessing the endometrium, which can easily
be identified and distinguished from the myometrium. Experience to
date demonstrates that the endometrial tissue is approximately isointense
with myometrium onT1-weighted images but appears higher in signal
intensity relative to myometrium on T2-weighted images. The thickness
of the endometrium in a normal menstruating female varies depending on
the phase of the menstrual cycle, being thinner in the follicular phase
and thicker in the secretory phase.22 Among patients who use oral contraceptives, the endometrial width is significantly
smaller in both the follicular and secretory phases. Additionally, the
junctional zone is also smaller in both phases of the menstrual
cycle. Myometrial thickness tends to remain the same regardless
of the phase of the menstrual cycle and the use of oral contraceptives. Such
differentiation allows better assessment of the endometrium and
may be particularly useful when Asherman's syndrome is suspected. The
normal endometrial width varies between individuals, ranging from 1 to 8 mm, whereas
the myometrial width varies from 1.5 to 2.5 cm. During
the normal follicular phase, endometrial width can grow from 1 to 3 mm.22 MRI is able to define depth of myometrial invasion, tumor site, and cervical
involvement in patients with endometrial cancer.23 Invasion of the myometrium is demonstrated by distortion of the junctional
zone (Fig. 6). In patients with deep myometrial invasion, this low-intensity band is
absent. MRI allows preoperative evaluation of the degree of invasion
before a postoperative pathology assessment. Although MRI cannot diagnose
endometrial cancer in situ (confined to endometrium), it is 92% accurate
in the overall staging of endometrial carcinoma.24 The overall accuracy in demonstrating depth of myometrial invasion ranges
from 71% to 86%.24, 25, 26, 27, 28, 29 Cervical involvement has been evaluated by Powell and colleagues, who
correctly detected cervical involvement in 11 of 12 patients.29 In the 12th patient there was only microscopic evidence of cervical invasion, which
was below the resolution of MRI. Tumor volume, which can
also be assessed by MRI, may be a more useful prognostic indicator than
depth of myometrial invasion. 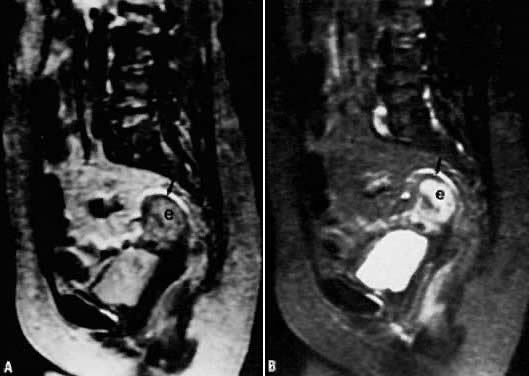 Fig. 6. A. Endometrial carcinoma. Slightly T2-weighted sagittal image in a patient
with endometrial carcinoma (e). Normal zonal anatomy has been disrupted. The
central region of high signal intensity represents endometrial
carcinoma that has invaded through the junctional zone and extends deeply
into the myometrium. Only a small rim of normal myometrium remains ( arrow ). B. A more T2-weighted image than in A, showing similar findings. Fig. 6. A. Endometrial carcinoma. Slightly T2-weighted sagittal image in a patient
with endometrial carcinoma (e). Normal zonal anatomy has been disrupted. The
central region of high signal intensity represents endometrial
carcinoma that has invaded through the junctional zone and extends deeply
into the myometrium. Only a small rim of normal myometrium remains ( arrow ). B. A more T2-weighted image than in A, showing similar findings.
|
Gadolinium enhancement with dynamic imaging has recently been investigated
with promising preliminary results. Because normal myometrium shows
more enhancement relative to tumor, Hirano and colleagues were able
to increase their sensitivity for detecting deep myometrial invasion from 89% to 91%.27 Yamashita reported an increased accuracy of 85% with dynamic imaging compared
with 68% when relying on T2-weighted spin-echo images.28 This enhancement occurred 120 seconds after administration of the gadolinium-enhancing
agent. With further investigations in this technique, diagnosis
and evaluation of endometrial carcinoma will be improved. Cervix A normal cervix has two distinguishable zones on MRI. The stroma is of
low signal intensity on T2-weighted images, whereas the endocervical canal
is represented by high signal intensity. The multiplanar capabilities
of MRI allow excellent visualization of the cervix and the surrounding
tissue, which is sometimes difficult on CT or ultrasonographic examination. Cervical cancer has an overall poor survival in the presence of advanced
invasive disease. Clinical staging has emphasized differentiation between
Stages IB, IIA, and IIB. The distinction is important, because carcinomas
staged less than or equal to IIA (i.e., disease without parametrial involvement) are usually treated with surgery, whereas
carcinomas of Stage IIB or greater (i.e., disease with parametrial involvement) are usually treated with radiotherapy. Clinical
staging of cervical cancer is currently performed by
physical examination, chest radiography, cystoscopy, intravenous pyelography, and
sigmoidoscopy. CT, the traditional method of radiologic staging, is
limited by an inability to image in multiple planes and by
poor soft-tissue delineation. MRI can detect cervical cancer, which has
increased signal intensity on T2-weighted images in contrast to surrounding
tissues; therefore, it is an important tool for clinical staging (Fig. 7).29 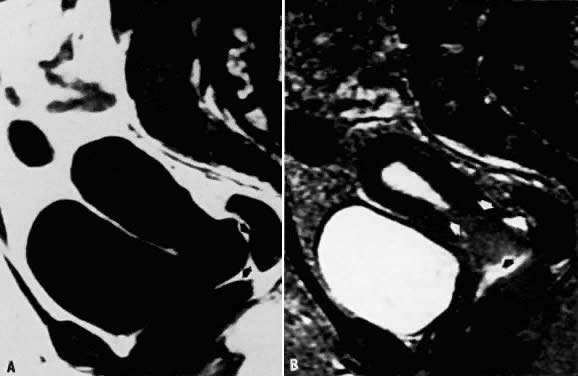 Fig. 7. A. Cervical carcinoma. Sagittal T1-weighted image showing prominence in the
region of the cervix. Distinction between the vagina, cervix, and a
soft-tissue mass is difficult ( arrows ). B. Sagittal T2-weighted image in the same location. The cervical carcinoma
can now be seen extending toward the fundus as well as into the vaginal
vault ( arrows ). Fig. 7. A. Cervical carcinoma. Sagittal T1-weighted image showing prominence in the
region of the cervix. Distinction between the vagina, cervix, and a
soft-tissue mass is difficult ( arrows ). B. Sagittal T2-weighted image in the same location. The cervical carcinoma
can now be seen extending toward the fundus as well as into the vaginal
vault ( arrows ).
|
Although MRI detection of parametrial involvement should, in theory, be
excellent, no rigid criteria are currently available (Fig. 8). Some authors have found MRI assessment of the parametrium to be 89% to 93% accurate.30, 31, 32 Others, however, have reported a slightly less impressive result of 79%.33 Some of the limiting factors may be distortion from hemorrhage and edema, as
well as distention of the vaginal fornix by large lesions.32 Inflamed parametrial tissues secondary to ulceration and infection of
the primary tumor or uterine instrumentation may affect the appearance
of parametrial tumor involvement. Overall, however, experience thus far
supports the greater accuracy of MRI in parametrial assessment compared
with CT scanning. In 22 women imaged with both CT and MRI before
surgery, MRI demonstrated an 86% accuracy rate in predicting the presence
or absence of parametrial involvement, compared with 77% for CT.34 In another study, MRI was able to identify all six cases of parametrial
extension, whereas CT detected only one case.35 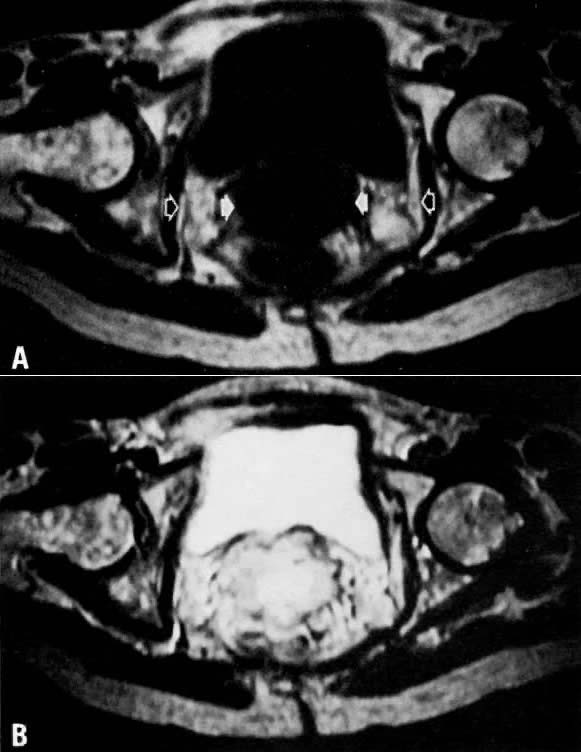 Fig. 8. A. Parametrial extension. Transverse T1-weighted image of a patient with
cervical carcinoma extending into the parametrium ( white arrows ). The pelvic side walls ( open arrows) are uninvolved. B. T2-weighted image showing the cancer to have high signal intensity. Fig. 8. A. Parametrial extension. Transverse T1-weighted image of a patient with
cervical carcinoma extending into the parametrium ( white arrows ). The pelvic side walls ( open arrows) are uninvolved. B. T2-weighted image showing the cancer to have high signal intensity.
|
MRI distinction of Stage IB from IIA is also reliable. Janus and colleagues
report a 91% accuracy of MRI for detecting vaginal extension, compared
with 77% for CT.34 Others have reported an accuracy rate of greater than 80%.32 Such assessment may be altered by distortion of the vaginal fornix as
a result of the size of the lesion. In such cases, tumor volume, which
can be accurately determined by MRI, may be an important parameter for
determining prognostic factors.36 Compared with examination under anesthesia, MRI staging is superior. In
one study, clinical examination under anesthesia underestimated the size
and extent of the tumor in six of ten cases of Stage IB cancer patients.37 In contrast, MRI correctly staged nine of these ten cancers. Recurrent cervical tumor can be distinguished from fibrosis by MRI. This
capability is particularly exciting. The distinction between these two
pathologies was reported by Ebner and colleagues, who noted that in
all six patients with recurrent tumor, signal intensity in the tumor
increased as the T2 weighting increased.38 This behavior was in contrast to that seen in fibrosis, which showed decreased
signal intensity when the T2 weighting increased. Other investigators
have confirmed these findings (Fig. 9 and Fig. 10).23, 39 It is important to note that the characteristics of fibrosis change with
time—that is, early radiation-induced fibrosis produces high
signal intensities on T2-weighted images, whereas older fibrosis yields
low-intensity signals on the same scans. Overall accuracy of MRI in
the diagnosis of recurrent tumor is 78%, with higher rates of accuracy
and specificity after 6 months.40 CT scanning cannot distinguish between recurrent tumor and fibrosis in
this manner. With ongoing development of paramagnetic contrast agents (substances
that accumulate in tissue and shorten relaxation times), the
diagnostic potential of MRI could be further extended. 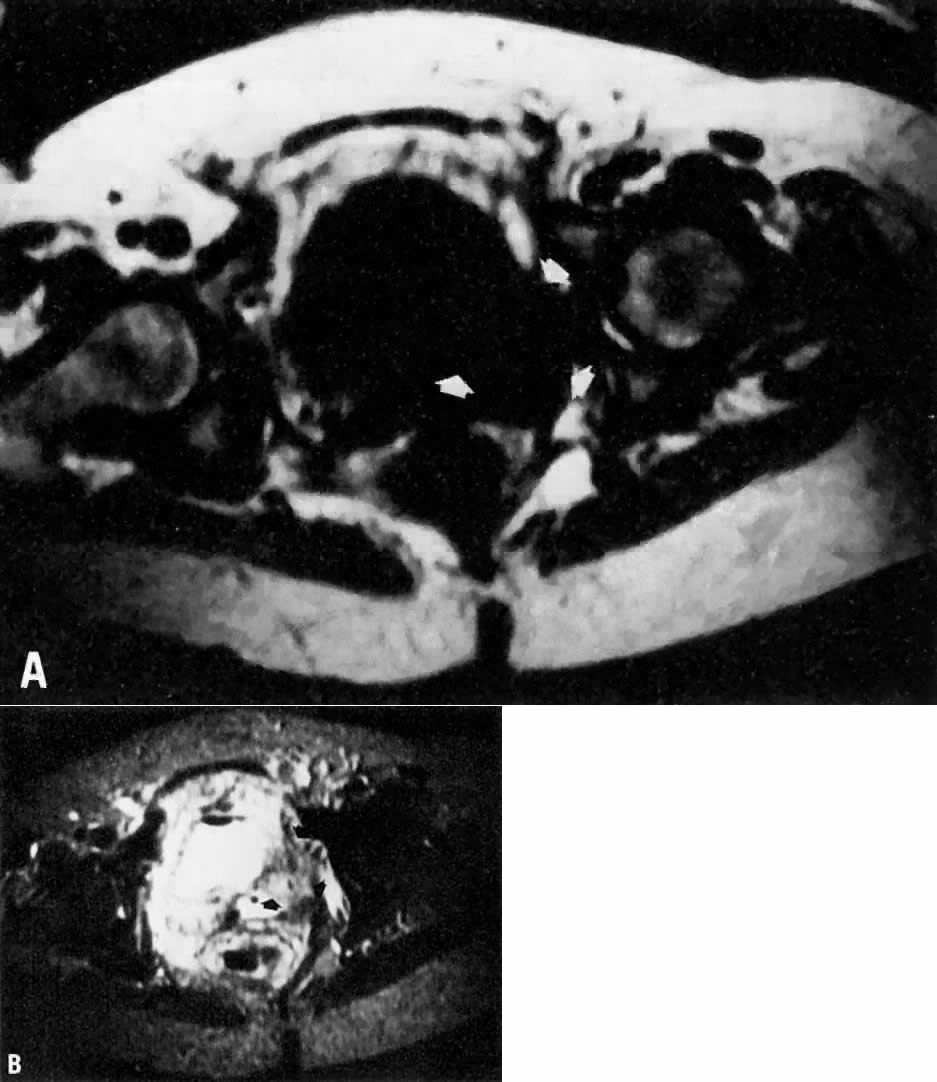 Fig. 9. A. Recurrent cervical carcinoma. Transverse T1-weighted image through the
pelvis showing a large left pelvic soft-tissue mass ( arrows ). B. With T2 weighting, the mass in A now shows increased signal intensity consistent with recurrent carcinoma. Fig. 9. A. Recurrent cervical carcinoma. Transverse T1-weighted image through the
pelvis showing a large left pelvic soft-tissue mass ( arrows ). B. With T2 weighting, the mass in A now shows increased signal intensity consistent with recurrent carcinoma.
|
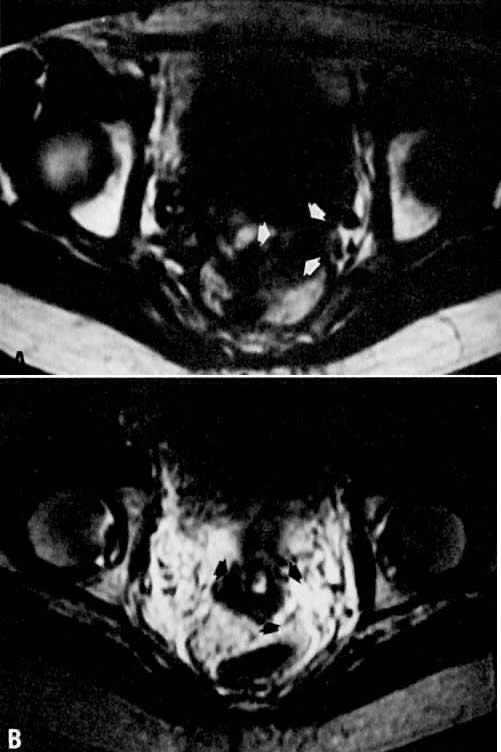 Fig. 10. A. Fibrosis. Transverse T1-weighted image showing minimal fullness in the
tissues surrounding the cervix ( arrows ). B. With T2 weighting, the tissues surrounding the cervix show no increase
in signal, suggesting radiation-induced fibrosis. Biopsy specimens failed
to identify persistent disease. Fig. 10. A. Fibrosis. Transverse T1-weighted image showing minimal fullness in the
tissues surrounding the cervix ( arrows ). B. With T2 weighting, the tissues surrounding the cervix show no increase
in signal, suggesting radiation-induced fibrosis. Biopsy specimens failed
to identify persistent disease.
|
An additional utility of MRI in cervical cancer has been its ability to
assess and follow tumor volume and change in T1 relaxation times during
and following therapy. Hawnaur and associates were able to demonstrate
reduction in tumor volume.41 However, there was no demonstrable relationship between rate of tumor
regression and prognosis. A better utility of MRI may derive from T1 relaxation
times that decreased with therapy but markedly increased with
tumor persistence.42 This parameter may help distinguish patients with differing tumor responses, thus
enabling clinicians to modify therapy. Further studies, however, are
needed. Ovary When an adnexal mass is found, it is often helpful to have a diagnosis
of the lesion before an exploratory laparotomy is performed. Several types
of ovarian lesions are particularly well evaluated by MRI; these
include hemorrhagic cysts (Fig. 11), endometrial cysts, benign teratomas, and simple follicular cysts. MRI
can readily identify hemorrhage because of relaxation differences between
methemoglobin, fresh hemoglobin, and hemosiderin. However, depending
on the biochemical state and age of the blood, the signal may be
bright or dark on either T1- or T2-weighted images.43 Endometrial cysts tend to have more adhesions on the external surface
and may lack a distinct margin from the uterine body.44 They may also demonstrate multiple loculations within the cyst. These
loculations tend to have high-intensity signals on T1- and T2-weighted
images, in contrast to water, which has high signal intensity on T2- and
low signal intensity on T1-weighted images. In the fibrous tissue
surrounding the cyst, a low-intensity area is occasionally identified
surrounding areas of acute and chronic bleeding and is thought to represent
the presence of hemosiderin-laden macrophages at the hematoma margin. One
other feature that is characteristic of endometrial cysts is
shading within loculi. Although the cause of the shading is not certain, it
is thought to be due to the presence of deoxyhemoglobin in unlysed
red blood cells or a higher concentration of paramagnetic (signal-enhancing) methemoglobin
within those regions. The presence of any or
all of these features should strongly suggest an endometrial cyst (Fig. 12). Further imaging using fat-saturation techniques significantly increases
the diagnostic accuracy of MRI for endometriomas, particularly large-sized
lesions.45 MRI has not been very sensitive in detecting endometrial implants. 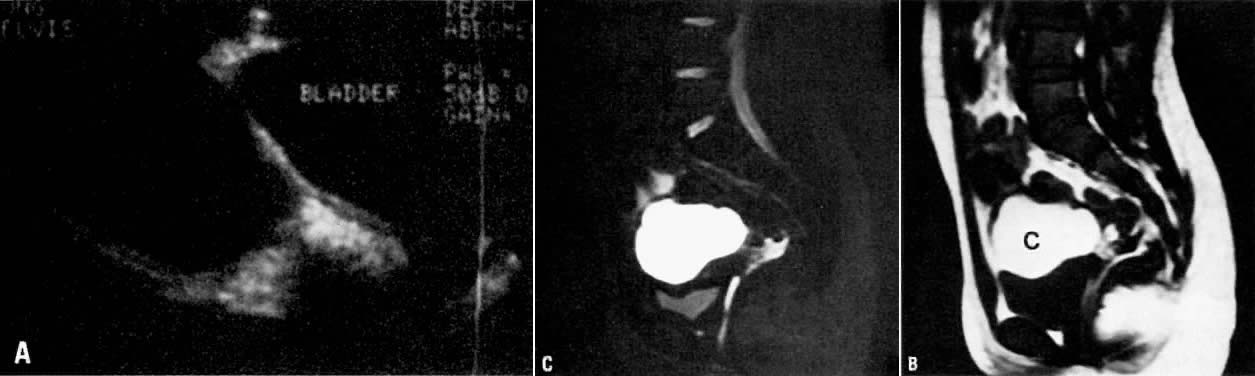 Fig. 11. A. Hemorrhagic cyst. Longitudinal view of the pelvis on ultrasonography showing
a large fluid-filled mass in the pelvis. B. Sagittal T1-weighted image showing a mass with high signal intensity superior
to the bladder (c). C. T2-weighted sagittal image showing the cyst to have persistently high
signal intensity. Findings are consistent with a hemorrhagic cyst subsequently
confirmed at surgery. Fig. 11. A. Hemorrhagic cyst. Longitudinal view of the pelvis on ultrasonography showing
a large fluid-filled mass in the pelvis. B. Sagittal T1-weighted image showing a mass with high signal intensity superior
to the bladder (c). C. T2-weighted sagittal image showing the cyst to have persistently high
signal intensity. Findings are consistent with a hemorrhagic cyst subsequently
confirmed at surgery.
|
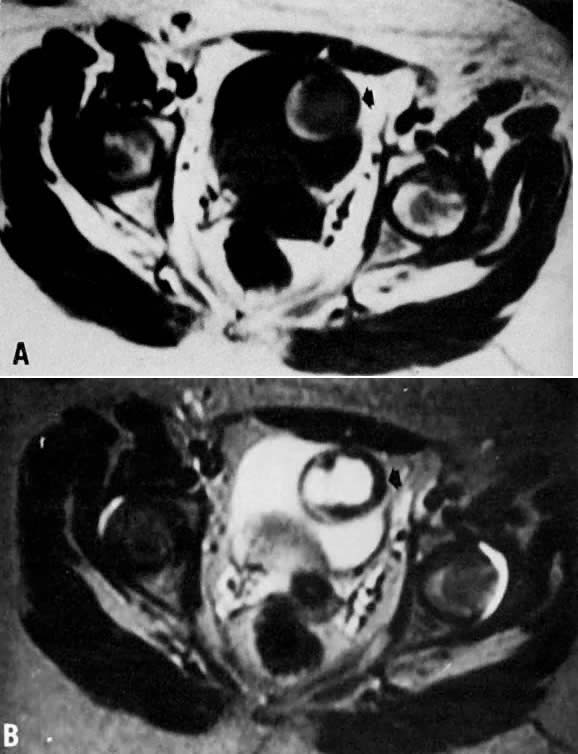 Fig. 12. A. Endometrioma. Transverse T1-weighted image showing a left adnexal mass
with areas of both increased and decreased signal ( arrow ). B. T2-weighted image showing change in signal intensities within the cyst
consistent with different stages of blood. Findings are consistent with
the final diagnosis of an endometrioma. Fig. 12. A. Endometrioma. Transverse T1-weighted image showing a left adnexal mass
with areas of both increased and decreased signal ( arrow ). B. T2-weighted image showing change in signal intensities within the cyst
consistent with different stages of blood. Findings are consistent with
the final diagnosis of an endometrioma.
|
Because of the large fat content within these tumors, ovarian cystic teratomas
produce signal intensities very similar to that of adjacent fat
on both T1- and T2-weighted images (Fig. 13). MRI may, in fact, be a more reliable diagnostic imaging modality for
such lesions than ultrasonography. In a review of 23 surgically proven
cases of ovarian teratomas in 18 patients, Togashi and colleagues noted
that ultrasonography and radiography were able to demonstrate 19 of
the 23 tumors and definitively identified only nine.46 Results of MRI, in contrast, were diagnostic in 20 of the 23 tumors, were
highly suggestive in 2 other lesions, and were nonspecific in only 1 case. Definitive
diagnosis could be made in lesions as small as 2 cm
in diameter. In addition to the high signal intensity attributed to
fat, debris and nodular protrusions are seen in these tumors. On occasion, teeth
and bone are also identified as areas with negligible signals
because of the high calcium and low water content, which yield little
signal on proton imaging. Fat/fluid levels may occasionally be seen
in teratomas. To distinguish fatty tumors from endometriomas, a unique
pattern of chemical shift artifact, a boundary artifact also seen in
fat, can be identified and used in conjunction with other characteristic
findings.46 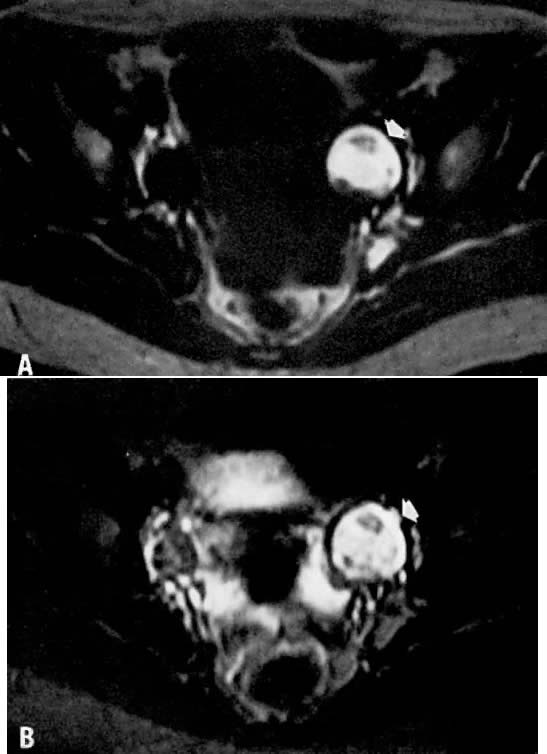 Fig. 13. A. Dermoid. T1-weighted transverse image showing a left adnexal cyst of high
signal intensity ( arrow ). B. With increased T2 weighting, the cyst shows persistently high signal intensity. Findings
are consistent with the diagnosis of a dermoid. Fig. 13. A. Dermoid. T1-weighted transverse image showing a left adnexal cyst of high
signal intensity ( arrow ). B. With increased T2 weighting, the cyst shows persistently high signal intensity. Findings
are consistent with the diagnosis of a dermoid.
|
Simple, follicular, corpus luteum, mucinous, and serous cystadenomas may
show similar MRI features. They tend to have low signal intensity on
T1-weighted images and higher signal intensity on T2-weighted images. There
are no differentiating signal characteristics between these cysts. As
with ultrasonography, morphologic criteria may provide some specificity (Fig. 14).47, 48 Solid ovarian benign and malignant tumors tend to have variable T1 and
T2 values and tend to have lower signal intensities overall. It is not
currently possible to distinguish benign from malignant lesions based
solely on the signal intensity. The diagnostic accuracy of MRI is reported
to be only 60%, although it is more reliable than ultrasonography
or CT.49 Image enhancement with gadolinium compound has reportedly increased characterization
of malignant lesions from 56% to 78% while increasing staging
accuracy from 63% to 75%.50 Such accuracy was possible with the use of previously established criteria, such
as the size of the lesion, the presence of solid components
and septations, the presence of a thickened cyst wall, and extraovarian
involvement. 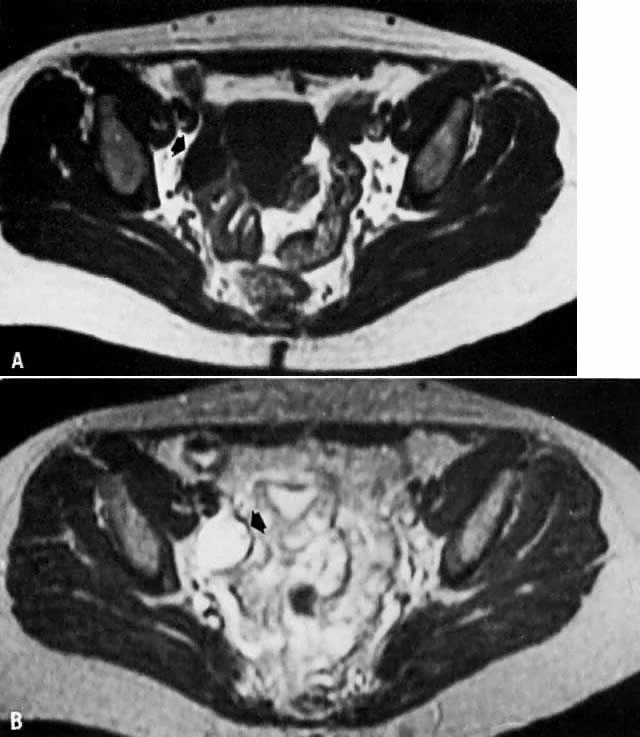 Fig. 14. A. Simple ovarian cyst. Transverse T1-weighted image showing a right adnexal
soft-tissue density of low signal intensity ( arrow ). B. With increased T2 weighting, the abnormality shows high signal intensity. The
thin wall and the appearance on both T1- and T2-weighted images
are consistent with the final diagnosis of a simple ovarian cyst. Fig. 14. A. Simple ovarian cyst. Transverse T1-weighted image showing a right adnexal
soft-tissue density of low signal intensity ( arrow ). B. With increased T2 weighting, the abnormality shows high signal intensity. The
thin wall and the appearance on both T1- and T2-weighted images
are consistent with the final diagnosis of a simple ovarian cyst.
|
MRI has been used to study polycystic ovarian syndrome. It is particularly
helpful in cases in which ultrasonographic examinations are equivocal. Because
it provides superior resolution and tissue contrast, MRI
has been able to assess ovarian morphology and has demonstrated subcapsular
cysts and stromal hyperplasia not necessarily seen on sonograms
because of limitations from ultrasound beam attenuation traveling through
dense structures such as thickened ovarian capsules.51, 52 Vagina Hricak and colleagues have shown that the vagina is easily identified by
MRI (see Fig. 3). As in the uterus, the vaginal mucosa has high signal intensity on T2-weighted
images, whereas the vaginal muscle itself has low signal intensity
on both T1- and T2-weighted images.53 The muscle is clearly differentiated from the surrounding fat. The amount
of vaginal mucus tends to fluctuate with the menstrual cycle. In 24 subjects, MRI
was accurate in depicting the presence, partial absence, or
total absence of the vagina. Identifying the presence of a vagina
may be helpful in cases with suspected müllerian defects as well
as in disorders of abnormal gonadal sex differentiations, such as Turner's
syndrome. Primary vaginal tumors are easy to identify, and their location, size, and
extension into the vaginal wall can be distinguished.54 Tumors have medium signal intensity on T1-weighted images and tend to
blend with adjacent vaginal tissue. Their appearance on T2-weighted scans
is variable. When the tumor infiltrates the vaginal wall, the low
signal intensity of the vaginal wall on T2-weighted images is distorted
or no longer seen, and the tissue plane between the vagina and adjacent
organs is obliterated. In one study, metastatic vaginal involvement
separate from the known primary tumor was correctly identified in 21 of 22 patients.54 MRI detection of vaginal involvement was reported to be 92% accurate, 95% sensitive, and 90% specific. Again, however, the tumor intensity was
found to be variable in this study. The overall role of MRI in vaginal
carcinoma needs to be further defined, because the value of any imaging
modality for assessing vaginal carcinoma has not yet been strongly
supported. Müllerian Anomalies Although ultrasonography is a standard imaging modality in gynecology, there
are several instances in which better definition of the internal
female anatomy is necessary (e.g., in patients with müllerian anomalies). In a young adolescent patient, an
informative, noninvasive imaging modality would be particularly
valuable if it could replace diagnostic laparoscopy or laparotomy. Recent
experience has demonstrated that MRI can be 100% accurate in müllerian
duct anomalies55, 56 and appears to be superior to endovaginal ultrasonography and hysterosalpingography. Pubertal
amenorrheic patients with cyclic lower abdominal
pain should be evaluated for vaginal agenesis and the presence of a
hematocolpos. MRI, with its multiplanar capabilities, has successfully
demonstrated vaginal agenesis in the absence or presence of a cervix, uterus, and
ovaries.57, 58, 59 In many cases, ultrasonography and CT imaging were performed in conjunction
with MRI but proved limited in recognizing the endometrium, cervix, and
vagina. MRI has been able to define the precise distance between
the distal vaginal dimple and the upper patent vagina, thus facilitating
preoperative planning of reconstructive surgery. Because vaginal agenesis is often associated with a hematocolpos and sometimes
with endometriosis, better definition of old and acute blood has
been one advantage of MRI. The blood within the hematocolpos, as in
endometriomas, may demonstrate variable signal intensity because of the
presence of acute and chronic blood. Such differences would aid in
the diagnosis of a pelvic mass in a young adolescent patient. Uterine abnormalities such as a bicornuate uterus or a septate uterus have
also been reported.60 Again, because of its multiplanar imaging capabilities, MRI has been able
to identify the presence of more than one cervix. It has also been
useful in tracing the extent of an intrauterine septum. These defects
are often noted only at the time of surgery or at hysteroscopy. Nodal Assessment One area where MRI has not proved to be very sensitive or specific is in
the assessment of nodal tumor involvement. MRI has a tendency to miss
tumor-positive lymph nodes.23 The accuracy of MRI in demonstrating lymph node involvement has been reported
by Togashi and colleagues to be 84%.32 The sensitivity was 60%, and the specificity was 91%. Affected nodes tend
to be brighter than muscle on T2-weighted images but darker than fat
on T1-weighted images.61 Nodes less than 2 cm in diameter tend to yield more false-negative results.34 Although as accurate as CT scanning, MRI detection of pelvic lymphadenopathy
is limited by longer imaging time, respiratory motion distortion, less
optimal spatial resolution, and difficulty in differentiation
from loops of bowel.62 At present, this form of nodal assessment cannot replace direct biopsy. Pelvic Thrombosis MRI has been shown to be useful in the diagnosis of deep venous thrombophlebitis
of the lower extremities. In a recent study, the presence or
absence of a deep venous thrombosis was correctly determined in 16 of 16 patients.63 MRI is exquisitely sensitive for detecting the presence of an intravascular
clot and has a clear advantage over duplex Doppler ultrasonography
because of its ability to study the internal deep venous system. Its
use in puerperal pelvic thrombophlebitis, however, has not been clearly
defined. Martin and colleagues were the first to use MRI to demonstrate
an ovarian vein thrombosis in a postpartum patient,64 and Woo and associates demonstrated patent ovarian veins in 89% of puerperal
patients.65 Further studies will, no doubt, demonstrate the utility of this sensitive
and noninvasive tool in gynecologic patients. Pelvic Floor Imaging One area of great potential for the use of MRI is in the area of urogynecology. In
the pelvic floor region, which is difficult to image by traditional
methods, MRI has been able to demonstrate uterine prolapse and
pelvic floor descent with standard and dynamic fast MR imaging. Sagittal
images allow visualization of the levator plate, which loses its
normal anatomic relationship to the symphysis pubis in the presence of
uterine prolapse (Fig. 15).66 With the use of dynamic fast MR imaging and cinematic display, prolapse
of the anterior, middle, and posterior compartments can be demonstrated
during straining in patients with pelvic prolapse compared with normal
patients.67 Such assessments may be valuable in preoperative planning and postoperative
follow-up. 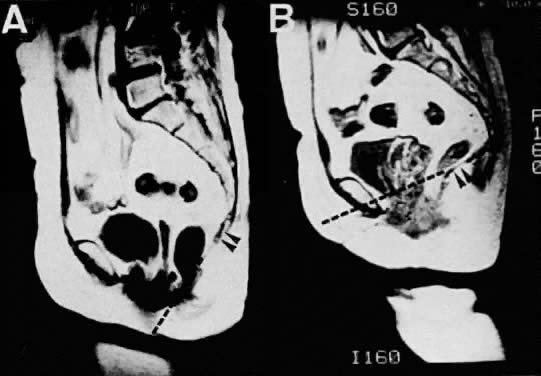 Fig. 15. Sagittal MR images of a 62-year-old patient with uterine prolapse before
corrective surgery (A) and after surgery (B). Note that the levator plate is highlighted by the dashed line and does not cross the symphysis prior to surgery but clearly crosses
the symphysis after surgery.(Ozasa H, Mori T, Togashi K: Study of uterine prolapse by magnetic resonance
imaging: Topographical changes involving the levator ani muscle
and the vagina. Gynecol Obstet Invest 34:43, 1992) Fig. 15. Sagittal MR images of a 62-year-old patient with uterine prolapse before
corrective surgery (A) and after surgery (B). Note that the levator plate is highlighted by the dashed line and does not cross the symphysis prior to surgery but clearly crosses
the symphysis after surgery.(Ozasa H, Mori T, Togashi K: Study of uterine prolapse by magnetic resonance
imaging: Topographical changes involving the levator ani muscle
and the vagina. Gynecol Obstet Invest 34:43, 1992)
|
|